Key Points
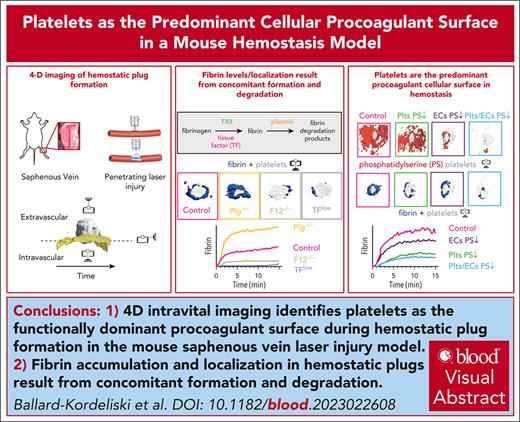
4D intravital imaging identifies platelets as the functionally dominant procoagulant surface during hemostatic plug formation.
Fibrin accumulation and localization in hemostatic plugs are the result of concomitant formation and degradation.
Visual Abstract
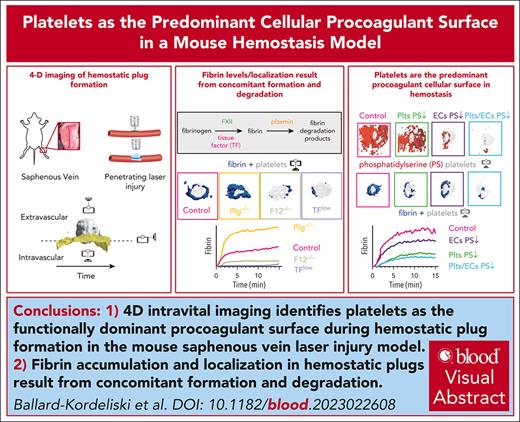
Interplay between platelets, coagulation factors, endothelial cells (ECs), and fibrinolytic factors is necessary for effective hemostatic plug formation. This study describes a 4-dimensional (4D) imaging platform to visualize and quantify hemostatic plug components in mice with high spatiotemporal resolution. Fibrin accumulation after laser-induced vascular injury was observed at the platelet plug–EC interface, controlled by the antagonistic balance between fibrin generation and breakdown. We observed less fibrin accumulation in mice expressing low levels of tissue factor or F12−/−mice compared with controls, whereas increased fibrin accumulation, including on the vasculature adjacent to the platelet plug, was observed in plasminogen-deficient mice or wild-type mice treated with tranexamic acid. Phosphatidylserine (PS), a membrane lipid critical for the assembly of coagulation factors, was first detected at the platelet plug–EC interface, followed by exposure across the endothelium. Impaired PS exposure resulted in a significant reduction in fibrin accumulation in cyclophilin D−/−mice. Adoptive transfer studies demonstrated a key role for PS exposure on platelets, and to a lesser degree on ECs, in fibrin accumulation during hemostatic plug formation. Together, these studies suggest that (1) platelets are the functionally dominant procoagulant cellular surface, and (2) plasmin is critical for limiting fibrin accumulation at the site of a forming hemostatic plug.
Introduction
Hemostatic plug formation is critical for the prevention of blood loss from sites of vascular injury. Platelets are rapidly recruited to the site of injury and form a loose platelet plug. Consolidation of the platelet plug depends on activation of the coagulation cascade, and the formation of a crosslinked fibrin matrix.1 The extrinsic pathway (tissue factor [TF]/factor VIIa [FVIIa]) is essential for hemostasis. TF from adventitial cells and pericytes forms a hemostatic envelope and rapidly activates the coagulation protease cascade after blood vessel injury.2-5 The coagulation cascade can also be activated by the contact/intrinsic pathway, involving coagulation factors FXII, FXI, and FIX.6 Both pathways converge on FX, which after cleavage to FXa complexes with FVa to form the prothrombinase complex required for the generation of thrombin.
Upon strong stimulation, platelets provide a negatively charged surface for the binding of coagulation factors that contain a γ-carboxyglutamic acid-rich domain, such as prothrombin, FVII, FIX, and FX. The change in platelet surface charge is achieved through the translocation of negatively charged phospholipids, such as phosphatidylserine (PS), from the inner to the outer leaflet of the plasma membrane, facilitated by various cellular changes including the depolarization of the mitochondrial membrane and prolonged high cytosolic calcium levels.7,8 Cyclophilin D (CypD) is an important regulator of the mitochondrial permeability transition pore, and platelets lacking CypD are markedly impaired in their ability to express PS on their surface.9 Elevated calcium, facilitated by mitochondrial depolarization, triggers the activation of the phospholipid scramblase, transmembrane protein 16F (TMEM16F), which facilitates PS translocation to the platelet surface.10,11 TMEM16F was identified as the gene affected in Scott syndrome, a rare congenital mild hemorrhagic disorder.12 Studies in animal models have demonstrated a key role for platelet TMEM16F in thrombus formation.13 Endothelial cells, through expression of TMEM16F and TMEM16E,14 also support prothrombinase complex assembly and thrombin generation via PS exposure on the cell surface.15-17 Moreover, TMEM16E-null mice had reduced vessel wall–dependent fibrin formation, indicating a role for TMEM16E in thrombus formation.14
Fibrin degradation is initiated by tissue plasminogen (Plg) activator that activates Plg to plasmin, the key fibrinolytic enzyme that degrades crosslinked fibrin in the plug. Studies in vitro and in vivo identified a key role for platelets in fibrinolysis.18,19 Platelets were found to affect both the quantity and the quality of the fibrin network, with fibers around platelets being more resistant to lysis compared with fibers that were not associated with platelets.20 In vitro and in vivo studies also suggest that Plg recruitment to platelets is almost entirely dependent on fibrin.19,21 Platelets also express the Plg receptor, Plg-RKT, and in vitro studies suggest a role for this receptor in Plg retention on the activated platelet membrane.22 As with platelets, endothelial cells (ECs) were shown to both positively and negatively regulate fibrinolysis.23 ECs constitutively release tissue Plg activator at low concentrations, which is retained on their surface and plays a role in promoting fibrinolysis in a fibrin-dependent manner.24 Urokinase-type Plg activator is also released by ECs upon stimulation. Interestingly, ECs and platelets also express and release Plg activator inhibitor 1 and thus can downregulate fibrinolysis under certain conditions.25,26 These data suggest that selective upregulation or downregulation of these factors would dictate the net fibrinolytic activity of the endothelium.
In this study, we describe a 4-dimensional (4D) imaging platform, which we used to investigate the interplay between platelets, endothelium, coagulation, and fibrinolysis during hemostatic plug formation with high spatiotemporal resolution. Using this new imaging modality in combination with knockout mice and an adoptive platelet transfer method,27 we demonstrate that (1) PS is rapidly expressed on adherent, activated platelets, coinciding in space and time with the accumulation of fibrin, (2) PS, but not fibrin, then is detected across the endothelium near the injury site, (3) fibrin accumulation is markedly reduced in CypD−/−mice and mice lacking CypD in platelets only, (4) Plg predominantly colocalizes with fibrin at the injury site, and (5) increased fibrin accumulation on the EC surface is observed in mice with impaired fibrinolysis.
Methods
For detailed methods, see supplemental Methods, available on the Blood website.
Platelet adoptive transfer model
Platelet adoptive transfer was performed as described previously.27
Saphenous vein laser injury model
Saphenous vein injury was performed as described previously.28
Image acquisition and analysis
Images were captured on a Zeiss Axio Examiner Z1 microscope equipped with a Yokogawa confocal scanning unit, CSU-W (Yokogawa Electric Co); 488, 561, 640 nm lasers (Intelligent Imaging Innovations); and an Orca Flash 4.0 camera (Hamamatsu). Confocal images were acquired with SlideBook 6.0 software (Intelligent Imaging Innovations) using the following settings: 100 milliseconds exposure time, 4 × 4 binning, and 7.5-μm Z-steps, unless otherwise noted. Images were exported as TIFF-OME files from SlideBook 6.0 software. Image analysis was done with ImageTank software (Visual Data Tools, Inc).29
Statistics
Statistical analysis was done using GraphPad Prism (GraphPad, Inc, La Jolla, CA). All analyses were done with Welch t tests, unless otherwise noted. Only injuries that did not rebleed were included in analysis.
All experiments were approved by the animal care and use committee of The University of North Carolina at Chapel Hill.
Results
An in vivo 4D imaging model of hemostasis
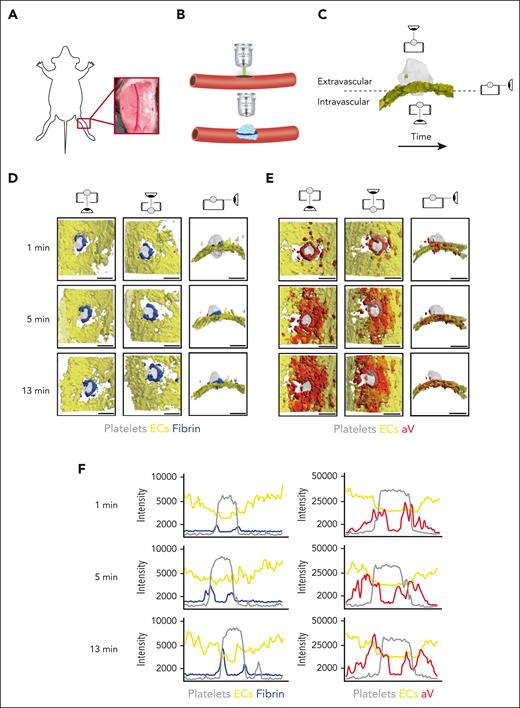
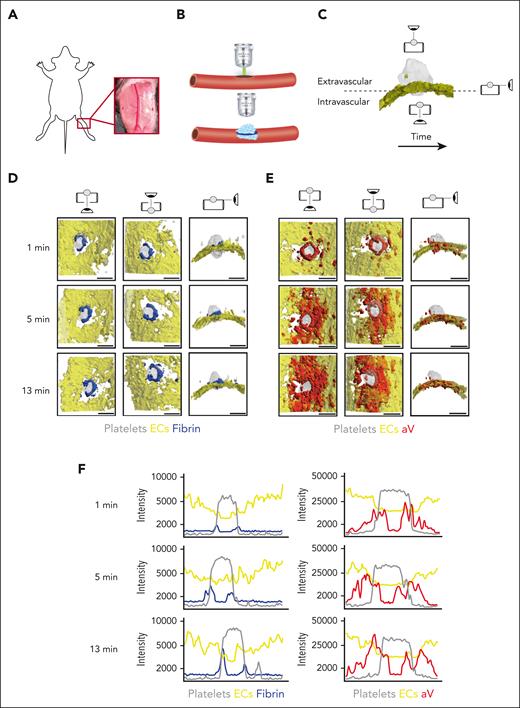
The saphenous vein laser injury model is a well-established method for imaging hemostasis in mice.28,30 Upon exposure of the saphenous vein (Figure 1A), laser ablation is used to create a penetrating vessel lesion with a diameter of ∼50 μm (Figure 1B). Traditionally, this model was limited to 3 dimensions, either 2D over time or 3D at a fixed time point. Here, we used time-lapse spinning disk confocal microscopy to image hemostatic plug formation in 3 dimensions and to provide enough temporal resolution to quantify enrichment of hemostatic plug components over time. Injuries analyzed in this study ranged from 40 to 60 μm in diameter; 150-μm Z-stacks of entire hemostatic plugs (Figure 1C) were sequentially recorded for 15 minutes at a step size of 7.5 μm and at 4 × 4 binning, requiring 4.33 seconds per fluorescence channel. Postacquisition generation and analysis of 4D videos was performed in ImageTank software.29 Videos with different view angles were generated (Figure 1C; supplemental Video 1).
4D imaging model of hemostatic plug formation. (A-C) Experimental setup. (A) Exposed saphenous vein. (B) Laser injury to saphenous vein was induced with Ablate! photoablation system with a 532-nm pulse laser. Accumulation and localization of various hemostatic plug components were recorded using a ZEISS Axio Examiner Z1 microscope with a 20×/1 numerical aperture water immersion objective lens and Slidebook software. (C) Sequential 150-μm Z-stacks of the forming hemostatic plug were acquired with 7.5-μm step size and 4 × 4 binning. Image analysis was performed with ImageTank Software (Visual Data Tools). Image shows surface view of platelets (gray) and ECs (yellow). Icons indicate intravascular, extravascular, and side perspective. (D-E) Visualization of platelets, ECs, fibrin, and PS at sites of vascular injury. Mice with green fluorescent protein (GFP)–expressing platelets (gray) and tdTomato-expressing endothelium (yellow) were infused with AF647-labeled antibody to fibrin (blue) (D) or AF647-labeled aV (red) (E). Images were taken at the indicated time points after laser injury. (F) Overlay of fluorescence intensity histograms for platelets (gray), ECs (yellow), and fibrin (blue) or PS (red) measured along 1 cross-sectional slice of a Z-max projection. Scale bar indicates 50 μm.
4D imaging model of hemostatic plug formation. (A-C) Experimental setup. (A) Exposed saphenous vein. (B) Laser injury to saphenous vein was induced with Ablate! photoablation system with a 532-nm pulse laser. Accumulation and localization of various hemostatic plug components were recorded using a ZEISS Axio Examiner Z1 microscope with a 20×/1 numerical aperture water immersion objective lens and Slidebook software. (C) Sequential 150-μm Z-stacks of the forming hemostatic plug were acquired with 7.5-μm step size and 4 × 4 binning. Image analysis was performed with ImageTank Software (Visual Data Tools). Image shows surface view of platelets (gray) and ECs (yellow). Icons indicate intravascular, extravascular, and side perspective. (D-E) Visualization of platelets, ECs, fibrin, and PS at sites of vascular injury. Mice with green fluorescent protein (GFP)–expressing platelets (gray) and tdTomato-expressing endothelium (yellow) were infused with AF647-labeled antibody to fibrin (blue) (D) or AF647-labeled aV (red) (E). Images were taken at the indicated time points after laser injury. (F) Overlay of fluorescence intensity histograms for platelets (gray), ECs (yellow), and fibrin (blue) or PS (red) measured along 1 cross-sectional slice of a Z-max projection. Scale bar indicates 50 μm.
Mice with green fluorescent protein–expressing platelets and tdTomato-expressing endothelium (mT/mG; PF4-Cre mice)31 were injected with an Alexa Fluor (AF) 647-labeled anti-fibrin antibody and hemostatic plug components were visualized after laser injury. Fibrin accumulation was rapidly observed at the edge of the platelet plug, forming a ring at the level of the endothelium/vessel wall (Figure 1D; supplemental Video 2). Although the intensity of the fibrin signal increased throughout the observation period, the ring pattern did not change. The localization of PS was also examined in mT/mG; PF4-Cre mice injected with AF647-labeled annexin-V (aV). At the 1-minute time point after injury, PS exposure was largely localized to the platelet plug–EC interface, similar to where we observed the fibrin ring (Figure 1E; supplemental Video 3). At later time points, however, PS was detected on ECs adjacent to the platelet plug. The difference in fibrin and PS signal in relation to the endothelium and the platelet plug is illustrated in Figure 1F, which shows overlays of histograms created from Z-max projections for each fluorescence channel at time (t) = 1, 5, and 13 minutes after injury.
To visualize PS exposure at the site of injury with even better temporal or spatial resolution, we modified our acquisition settings by reducing the Z travel distance (50 μm vs 150 μm) and the number of fluorescence channels acquired (2 vs 3; supplemental Figure 1) and by changing to a smaller Z-step size (2.5 μm vs 7.5 μm) and 2 × 2 binning (supplemental Figure 2). Imaging with higher spatial or temporal resolution confirmed our findings on PS exposure and fibrin accumulation at injury sites obtained with settings used to visualize the entire hemostatic plug (Figure 1). To further characterize the level of cellular activation at the injury site, we also visualized surface-expressed P-selectin, a marker of strong activation and granule secretion in platelets and ECs.32,33 After laser injury, P-selectin surface expression was observed at the edge of the platelet plug and on the surrounding vasculature. Thus, P-selectin surface expression was observed in close proximity to PS-positive cells (supplemental Figure 3A) and fibrin (supplemental Figure 3B). Adoptive transfer studies with P-selectin–deficient platelets showed that P-selectin staining at the plug-vasculature interface was predominantly because of expression on activated platelets (supplemental Figure 4).
Fibrin accumulation at a site of injury is determined by an antagonistic balance between fibrin formation and fibrin degradation
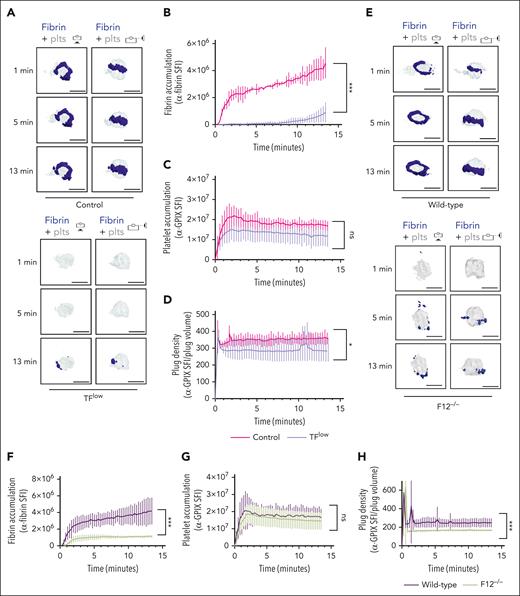
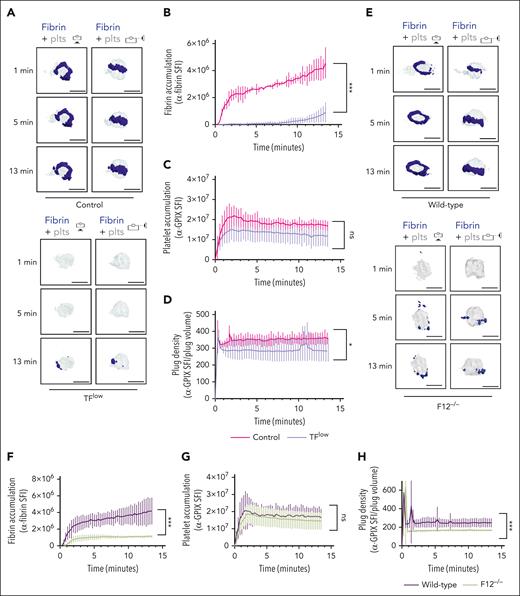
To determine the contribution of the extrinsic and intrinsic coagulation pathways to thrombin/fibrin generation at the site of hemostatic plug formation, we performed 4D imaging studies in mice expressing a low level of TF (TFlow)34 and mice deficient in FXII (F12−/−).35 Consistent with the key role of TF in coagulation initiation, we observed a markedly delayed and significantly reduced accumulation of fibrin within hemostatic plugs in TFlow mice when compared with control mice (Figure 2A-B; supplemental Video 4). Similar to controls, the limited fibrin accumulation still occurred at the edge of the platelet plug. Platelet accumulation (Figure 2C) and plug volume (supplemental Figure 5A-B) were not significantly altered, whereas platelet plug density (ratio between platelet accumulation and plug volume) in these plugs was slightly reduced when compared with control plugs (Figure 2D; supplemental Figure 5A). Significantly less fibrin accumulation was also observed in F12−/−mice (Figure 2E-F; supplemental Video 5), especially at t of >2 minutes after laser injury. Platelet accumulation in F12−/−plugs was not altered (Figure 2G). However, platelet plug density in F12−/−mice was significantly lower than in WT (Figure 2H) because of an increase in plug volume (supplemental Figure 5C-D). Together, these findings are consistent with a key role for the extrinsic pathway in the initiation of thrombin generation after laser injury, whereas FXII is critical for subsequent contact pathway activation in this model.
Both TF and FXII are critical for fibrin accumulation at sites of hemostatic plug formation. (A-D) Platelet (anti–GPIX-AF488) and fibrin (anti–fibrin-AF647) accumulation at injury sites in littermate control (top panel) and TFlow mice (bottom panel). (A) Representative images showing surface view for fibrin ring (blue) around platelet plug (gray). (B) Sum fluorescence intensity (SFI) ± standard error of the mean (SEM) for fibrin signal. (TFlow, n = 15 injuries in 3 mice; and control, n = 14 injuries in 3 mice). (C) SFI ± SEM for platelet signal. (TFlow, n = 15 injuries in 3 mice; and control, n = 11 injuries in 3 mice). (D) Plug density as determined by the ratio between anti-GPIX SFI and plug volume. (TFlow, n = 12 injuries in 3 mice; and control, n = 11 injuries in 3 mice). (E-H) Platelet (anti–GPIX-AF488) and fibrin (anti–fibrin-AF647) accumulation at injury sites in WT (top panel) and F12−/−mice (bottom panel). (E) Representative images. (F) SFI ± SEM for fibrin signal. (F12−/−, n = 19 injuries in 4 mice; and WT, n =19 injuries in 3 mice). (G) SFI ± SEM for platelet signal. (F12−/−, n = 22 injuries in 4 mice; and WT, n = 20 injuries in 3 mice). (H) Plug density. (F12−/−, n = 22 injuries in 4 mice; and WT, n = 20 injuries in 3 mice). Statistical significance was determined for fluorescence signals of the last 3D stack acquired during the observation period. ns, not significant; ∗P < .05; ∗∗∗P < .001. Scale bar indicates 50 μm.
Both TF and FXII are critical for fibrin accumulation at sites of hemostatic plug formation. (A-D) Platelet (anti–GPIX-AF488) and fibrin (anti–fibrin-AF647) accumulation at injury sites in littermate control (top panel) and TFlow mice (bottom panel). (A) Representative images showing surface view for fibrin ring (blue) around platelet plug (gray). (B) Sum fluorescence intensity (SFI) ± standard error of the mean (SEM) for fibrin signal. (TFlow, n = 15 injuries in 3 mice; and control, n = 14 injuries in 3 mice). (C) SFI ± SEM for platelet signal. (TFlow, n = 15 injuries in 3 mice; and control, n = 11 injuries in 3 mice). (D) Plug density as determined by the ratio between anti-GPIX SFI and plug volume. (TFlow, n = 12 injuries in 3 mice; and control, n = 11 injuries in 3 mice). (E-H) Platelet (anti–GPIX-AF488) and fibrin (anti–fibrin-AF647) accumulation at injury sites in WT (top panel) and F12−/−mice (bottom panel). (E) Representative images. (F) SFI ± SEM for fibrin signal. (F12−/−, n = 19 injuries in 4 mice; and WT, n =19 injuries in 3 mice). (G) SFI ± SEM for platelet signal. (F12−/−, n = 22 injuries in 4 mice; and WT, n = 20 injuries in 3 mice). (H) Plug density. (F12−/−, n = 22 injuries in 4 mice; and WT, n = 20 injuries in 3 mice). Statistical significance was determined for fluorescence signals of the last 3D stack acquired during the observation period. ns, not significant; ∗P < .05; ∗∗∗P < .001. Scale bar indicates 50 μm.
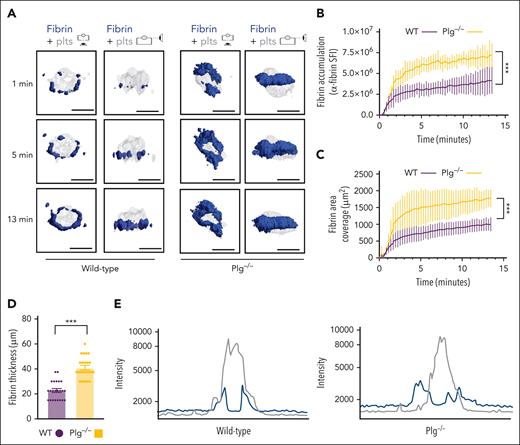
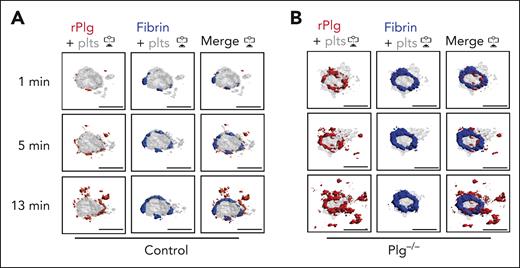
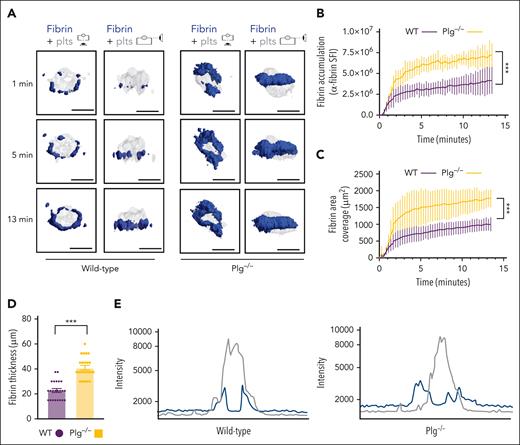
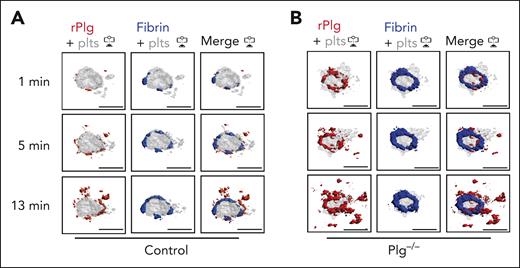
Next, we studied how fibrinolysis affects fibrin accumulation in hemostatic plugs. Significantly greater fibrin accumulation within the plugs was observed in Plg-deficient (Plg−/−) mice36 (Figure 3A-B; supplemental Video 6) or wild-type (WT) mice treated with tranexamic acid, an antifibrinolytic compound that inhibits Plg and plasmin binding to fibrin37 (supplemental Figure 6). Interestingly, the increase in fibrin accumulation was observed at all time points throughout the observation period. The increased fibrin in Plg−/− mice was observed at the platelet plug–EC interface and intravascularly along the endothelial surface (Figures 3A; supplemental Figure 7), and both increased fibrin surface area (Figure 3C) and increased fibrin ring thickness (Figure 3D) were observed. Intensity plots overlaying the fluorescence intensity for platelets and fibrin further illustrate the expansion of fibrin accumulation onto the endothelium, away from the platelet plug (Figure 3E; supplemental Video 7). To directly visualize Plg localization within the plug, mice were transfused with catalytically inactive, AF647-labeled recombinant Plg (rPlg)38 before laser injury. We observed colocalization of rPlg with fibrin immediately after laser injury in control (Figure 4A) and Plg−/−mice (Figure 4B). At later time points, rPlg binding was also observed away from the fibrin ring.
Increased fibrin accumulation at sites of hemostatic plug formation in plasminogen-deficient mice. (A) Representative images for fibrin (blue) and platelet (gray) accumulation at the indicated time points after laser injury in WT (left panel) and Plg−/−mice (right panel). (B) SFI ± SEM for fibrin signal. (Plg−/−, n = 15 injuries in 4 mice; and WT, n = 19 injuries in 3 mice). Same controls as in Figure 2F. (C) Fibrin area coverage (μm2). (D) Fibrin ring thickness (μm) measured at t = 13 minutes after laser injury. (E) Overlay of fluorescence intensity histograms for platelets (gray) and fibrin (blue) in plugs from a WT (left panel) or Plg−/− mouse (right panel), measured along 1 cross-section slice of a Z-max projection. Statistical significance was determined for fluorescence signals of the last 3D stack acquired during the observation period. ∗∗∗P < .001. Scale bar indicates 50 μm.
Increased fibrin accumulation at sites of hemostatic plug formation in plasminogen-deficient mice. (A) Representative images for fibrin (blue) and platelet (gray) accumulation at the indicated time points after laser injury in WT (left panel) and Plg−/−mice (right panel). (B) SFI ± SEM for fibrin signal. (Plg−/−, n = 15 injuries in 4 mice; and WT, n = 19 injuries in 3 mice). Same controls as in Figure 2F. (C) Fibrin area coverage (μm2). (D) Fibrin ring thickness (μm) measured at t = 13 minutes after laser injury. (E) Overlay of fluorescence intensity histograms for platelets (gray) and fibrin (blue) in plugs from a WT (left panel) or Plg−/− mouse (right panel), measured along 1 cross-section slice of a Z-max projection. Statistical significance was determined for fluorescence signals of the last 3D stack acquired during the observation period. ∗∗∗P < .001. Scale bar indicates 50 μm.
Plasminogen rapidly localizes to fibrin ring during hemostatic plug formation. Mice were injected with anti–fibrin-AF488 antibody, anti–GPIX-AF568 antibody, and AF647-conjugated, catalytically inactive rPlg. (A-B) Representative images (intravascular view) for fibrin (blue), platelets (gray), and rPlg (red) staining at the indicated time points after laser injury in control (A) or Plg−/− mice (B). Scale bar indicates 50 μm.
Plasminogen rapidly localizes to fibrin ring during hemostatic plug formation. Mice were injected with anti–fibrin-AF488 antibody, anti–GPIX-AF568 antibody, and AF647-conjugated, catalytically inactive rPlg. (A-B) Representative images (intravascular view) for fibrin (blue), platelets (gray), and rPlg (red) staining at the indicated time points after laser injury in control (A) or Plg−/− mice (B). Scale bar indicates 50 μm.
Platelet PS exposure is critical for fibrin accumulation
CypD is an important regulator of the mitochondrial permeability transition pore that is expressed in platelets and ECs.9,39 To study the impact of impaired PS exposure on hemostatic plug formation, we analyzed mice with global (CypD−/−) deficiency in the saphenous vein laser injury model with 4D imaging. As shown in Figure 1, both aV staining and fibrin accumulation were observed at the platelet plug–EC interface 1 minute after laser injury to the saphenous vein of WT mice, and then the aV signal continued to spread across the endothelium while fibrin remained constrained to the plug (Figure 5A; supplemental Video 8). CypD−/−mice exhibited markedly decreased PS exposure with very little PS near the platelet plug at early time points after injury and minimal PS on the endothelium at later time points (Figure 5B,C). Consistent with a key role of PS-positive surfaces in the assembly and activation of coagulation factors, significantly less fibrin accumulation was observed at sites of laser injury in CypD−/−mice (Figures 5B,D). Platelet accumulation was not significantly different between CypD−/−and control mice (Figure 5E).
PS exposure potentiates fibrin accumulation around the platelet plug. (A-B) Surface view for accumulation of PS (red [aV]; left panel), fibrin (blue; right panel), and platelets (gray) at the indicated time points during hemostatic plug formation in WT (A), and CypD−/−mice (B). (C-E) SFI ± SEM over time for PS (CypD−/−, n = 7 injuries in 3 mice; and WT, n = 8 injuries in 3 mice) (C), fibrin (CypD−/−, n = 27 injuries in 3 mice; and WT, n = 19 injuries in 3 mice) (D), and platelets (CypD−/−, n = 27 injuries in 3 mice and WT, n = 20 injuries in 3 mice) (E). Same WT controls as in Figure 2. Statistical significance was determined for fluorescence signals of the last 3D stack acquired during the observation period. ns, not significant; ∗P < .01; ∗∗∗P < .001. Scale bar indicates 50 μm.
PS exposure potentiates fibrin accumulation around the platelet plug. (A-B) Surface view for accumulation of PS (red [aV]; left panel), fibrin (blue; right panel), and platelets (gray) at the indicated time points during hemostatic plug formation in WT (A), and CypD−/−mice (B). (C-E) SFI ± SEM over time for PS (CypD−/−, n = 7 injuries in 3 mice; and WT, n = 8 injuries in 3 mice) (C), fibrin (CypD−/−, n = 27 injuries in 3 mice; and WT, n = 19 injuries in 3 mice) (D), and platelets (CypD−/−, n = 27 injuries in 3 mice and WT, n = 20 injuries in 3 mice) (E). Same WT controls as in Figure 2. Statistical significance was determined for fluorescence signals of the last 3D stack acquired during the observation period. ns, not significant; ∗P < .01; ∗∗∗P < .001. Scale bar indicates 50 μm.
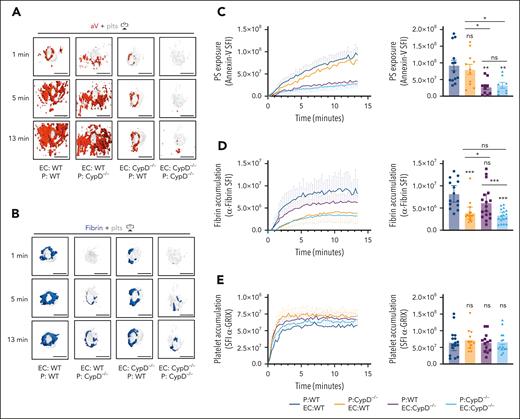
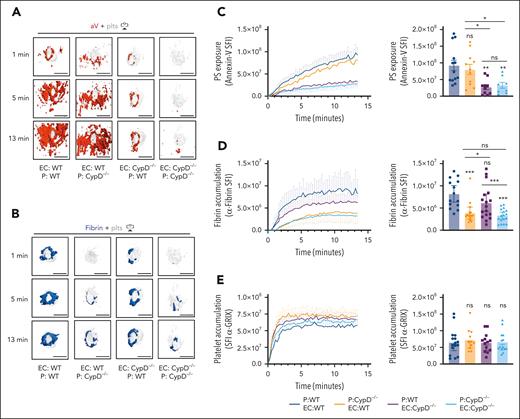
To investigate the relative roles of platelet PS vs EC PS in fibrin accumulation at a site of vascular injury, we performed studies in mice lacking CypD in platelets only (EC:WT; P [platelets]:CypD−/−) or mice expressing CypD in platelets only (EC:CypD−/−; P:WT). These mice and appropriate controls were generated by adoptive transfer of CypD−/−or WT platelets into thrombocytopenic IL4R/GPIb-tg or CypD−/−;IL4R/GPIb-tg mice.27,40 The spatiotemporal characteristics of aV staining and fibrin accumulation at sites of laser injury were comparable between thrombocytopenic IL4R/GPIb-tg mice receiving WT platelets (EC:WT; P:WT; Figure 6A-D; supplemental Video 8) and nondepleted, nontransfused WT mice (Figure 5). A lack of CypD in platelets only (EC:WT; P:CypD−/−) did not significantly impair total PS exposure in the vicinity of the hemostatic plug at later time points (Figure 6A,C), but our imaging frequently showed a delay in PS exposure at the platelet plug–EC interface at early time points after laser injury (see “1 minute” images in Figure 6A; supplemental Video 9). In contrast, the first ring of PS-positivity at the plug-EC interface was still observed in mice expressing CypD in platelets only (EC:CypD−/−; P:WT) whereas overall PS exposure at the injury site was significantly reduced (Figure 6A,C; supplemental Video 9). PS exposure was markedly reduced at sites of laser injury in mice deficient in CypD in both platelets and ECs (EC:CypD−/−; P:CypD−/−; Figure 6A,C; supplemental video 9). Next, we tested how reduced PS exposure in platelets and/or ECs affected fibrin accumulation at the injury site. Consistent with studies in CypD−/−mice (Figure 5), fibrin accumulation was significantly impaired in EC:CypD−/−; P:CypD−/−mice (Figure 6B,D; supplemental Video 9). A similar reduction in fibrin accumulation was observed in EC:WT; P:CypD−/−mice (Figure 6B,D; supplemental video 9), whereas only a trend to reduced fibrin accumulation was observed in EC:CypD−/−; P:WT mice (Figure 6B,D; supplemental Video 9). Platelet accumulation was not significantly affected under either of the experimental conditions (Figure 6E), similar to what we observed in CypD−/−mice (Figure 5). These studies provide genetic evidence for platelet PS as the predominant cellular procoagulant surface during hemostatic plug formation after laser injury to the saphenous vein.
Platelet PS exposure is critical to fibrin accumulation during hemostatic plug formation. Mice expressing CypD in platelets and ECs (EC:WT; P:WT), mice lacking CypD in platelets only (EC:WT; P:CypD−/−), mice expressing CypD in platelets only (EC:CypD−/−; P:WT), or mice lacking CypD in both platelets and endothelium (EC:CypD−/−; P: E:CypD−/−) were generated by adoptive transfer technology (see “Methods”). (A) Surface view for accumulation of PS (aV, red) and platelets (gray) at the indicated time points during hemostatic plug formation in EC:WT; P:WT, EC:WT; P:CypD−/−, EC:CypD−/−; P:WT, or EC:CypD−/−; P: EC:CypD−/−(left to right) mice. (B) Fibrin (anti–fibrin-AF647, blue) and platelet (gray) accumulation at the indicated time points during hemostatic plug formation in the indicated mice. (C-E) SFI ± SEM over time for aV (C), fibrin (D), and platelets (E); n = 8 to 17 injuries in 3 to 4 mice. Statistical significance was determined for fluorescence signals of the last 3D stack acquired during the observation period (bar graphs on the right). ns, not significant; ∗P < .05; ∗∗P < .01; ∗∗∗P < .001. Scale bar indicates 50 μm.
Platelet PS exposure is critical to fibrin accumulation during hemostatic plug formation. Mice expressing CypD in platelets and ECs (EC:WT; P:WT), mice lacking CypD in platelets only (EC:WT; P:CypD−/−), mice expressing CypD in platelets only (EC:CypD−/−; P:WT), or mice lacking CypD in both platelets and endothelium (EC:CypD−/−; P: E:CypD−/−) were generated by adoptive transfer technology (see “Methods”). (A) Surface view for accumulation of PS (aV, red) and platelets (gray) at the indicated time points during hemostatic plug formation in EC:WT; P:WT, EC:WT; P:CypD−/−, EC:CypD−/−; P:WT, or EC:CypD−/−; P: EC:CypD−/−(left to right) mice. (B) Fibrin (anti–fibrin-AF647, blue) and platelet (gray) accumulation at the indicated time points during hemostatic plug formation in the indicated mice. (C-E) SFI ± SEM over time for aV (C), fibrin (D), and platelets (E); n = 8 to 17 injuries in 3 to 4 mice. Statistical significance was determined for fluorescence signals of the last 3D stack acquired during the observation period (bar graphs on the right). ns, not significant; ∗P < .05; ∗∗P < .01; ∗∗∗P < .001. Scale bar indicates 50 μm.
Discussion
Both platelets and ECs can provide a negatively charged, procoagulant surface. However, their respective contributions to the assembly of coagulation complexes and subsequent thrombin generation and fibrin formation within hemostatic and thrombotic plugs are controversial. In this study, we describe a 4D imaging platform to visualize and quantify hemostatic plug components in the saphenous vein of mice. Our studies suggest that platelet PS is more critical than EC PS for thrombin generation and fibrin accumulation in this mouse model of hemostasis, and that rapid onset fibrinolysis is 1 reason for limited fibrin accumulation on PS-expressing ECs.
Fibrin accumulation and precise localization during hemostatic plug formation in our model was the result of an antagonistic balance between fibrin formation and breakdown. Our observation of significantly reduced fibrin accumulation in F12−/−mice seems surprising considering that patients and mice deficient in FXII do not bleed.41 However, there is considerable evidence that FXII is critical for thrombin/fibrin formation in atherothrombosis and venous thrombosis in mouse models, that is, situations in which thrombus formation is initiated by small amounts of TF and propagated by the contact pathway.42-44 Our studies demonstrate a similar initiation/propagation mechanism for hemostatic plugs after laser injury, with TF playing a critical role for coagulation initiation. Interestingly, neither TFlow nor F9−/−mice exhibited excess bleeding in the saphenous vein bleeding model,28 and even mice treated with high-dose hirudin showed only a partial hemostasis defect.45 Fibrin accumulation at sites of injury was dramatically reduced in TFlow mice. However, the residual level of TF expression in TFlow mice seems sufficient to both prevent spontaneous bleeding and excessive bleeding in this small injury saphenous vein model as well as in a tail vein transection model.28,46 Residual thrombin generation activity, provided by the extrinsic pathway and/or FXII-independent FXI activation, likely also explains why F12−/−mice did not show excess bleeding, although fibrin levels surrounding plugs were significantly reduced.
Our studies also demonstrate that Plg is rapidly recruited to the hemostatic plug, mostly associated with the fibrin ring, resulting in conversion to plasmin and a rapid increase of fibrinolytic activity at the site of a forming plug. This finding is consistent with previous work that showed rapid Plg recruitment to fibrin formed under flow conditions in vitro and in vivo.19,21,47 However, we also observed Plg binding in areas in which we did not observe fibrin, likely because of other binding sites such as the recently described receptor, Plg-RKT,22 S100A10,48 or PS-positive cells.19 The possibility that rPlg recruitment to the vasculature, away from the fibrin ring, is mediated by trace amounts of fibrin(ogen) that are below the detection threshold of our system, however, also needs to be considered. Importantly, we observed significantly increased fibrin levels in Plg−/−mice or WT mice treated with tranexamic acid. An increase in fibrin-positive area and fibrin ring thickness was measured, suggesting that plasmin activity leads to reduced fibrin accumulation within, and on, ECs directly adjacent to the platelet plug. Thus, plasmin is generated and positioned to spatially confine fibrin accumulation during hemostatic plug formation.
Our 4D imaging method also allowed us to visualize both PS exposure and fibrin accumulation in 3 dimensions during hemostatic plug formation. We observed fibrin accumulation only at the platelet plug–EC interface, whereas PS exposure started at the platelet plug–EC interface but then spread across the endothelium. These findings are consistent with those of Kaplan et al, who reported a very similar pattern for PS exposure and fibrin accumulation after needle puncture to mesenteric veins in mice.49 Using our 4D imaging method, we further show that PS exposure shortly after laser injury (at t ∼1 minute) occurs in very close proximity to fibrin and degranulated platelets at the periphery of the plug. This first ring of PS-positive cells was still observed in mice expressing CypD in platelets only (E:CypD−/−; P:WT), whereas it was difficult to detect in CypD−/−mice and mice lacking CypD in platelets only (E:WT; P:CypD−/−). The spread of PS along the vasculature observed at later time points (>2 minutes after laser damage) in control mice was significantly impaired in mice expressing CypD in platelets only (E:CypD−/−; P:WT). Importantly, fibrin accumulation was significantly reduced in mice lacking CypD in platelets only (E:WT; P:CypD−/−) but not in mice expressing CypD in platelets only (E:CypD−/−; P:WT). Thus, although ECs account for most of the PS signal at the injury site, PS-exposing platelets are the more critical procoagulant surface, at least in this mouse model of hemostasis.
Our finding that PS-positive platelets play a predominant role in fibrin formation during hemostatic plug formation is in agreement with impaired hemostasis reported for mice deficient in TMEM16F in megakaryocytes and platelets only.15 In vitro, TMEM16F-deficient platelets showed a partial protection from agonist-induced PS exposure, leading to a significant reduction in thrombin generation.10,15 In vivo, mutant mice exhibited prolonged bleeding after tail transection, a large injury model. The observations described for megakaryocyte-/platelet-specific TMEM16F knockout mice are similar to those reported for global TMEM16F knockout mice, suggesting that bleeding observed in this model of Scott syndrome is the result of impaired platelet procoagulant activity.11,50
Our results on procoagulant activity and fibrin accumulation at sites of hemostatic plug formation are also partially consistent with findings reported by Ivanciu et al17 and Schmaier et al.14 Both groups used intravital microscopy imaging after laser damage to the cremaster microcirculation to demonstrate that prothrombinase complex and PS accumulation at sites of vascular injury are mostly found away from the platelet thrombus. However, these studies also showed that impaired platelet adhesion/activation had little effect on fibrin accumulation at the injury site, suggesting that ECs play a predominant role as a procoagulant surface during thrombus formation. The most obvious differences between these studies and our work are the type of imaging, the type of injury, and the affected vessel itself. We used spinning disk confocal fluorescence microscopy to sequentially image large Z-stacks of entire hemostatic plugs with relatively high speed. Although this setup enabled us to image hemostatic plugs in 3 dimensions at a rate of ∼12 frames per minute per fluorescence channel, our temporal resolution was not as high as that reported for higher frequency 2D imaging studies (∼2 frames per second). However, we obtained similar results in studies at a higher imaging speed (∼25 images per minute per fluorescence channel), and we provide genetic evidence that platelets are the predominant procoagulant cellular surface during hemostatic plug formation in our mouse model of hemostasis. Thus, the injury type and the vessel that was injured are more likely responsible for the discrepant findings. We generated 50 μm in diameter penetrating lesions to the saphenous vein that caused significant bleeding, even in the presence of fully functional platelets. In contrast, both Ivanciu et al17 and Schmaier et al14 created smaller injuries in cremaster arterioles that caused minimal red blood cell extravasation, even in the absence of functional platelets. Thus, our injuries are more severe and likely cause stronger platelet activation (including procoagulant activity) due to exposure to extracellular matrix and subendothelial TF.
The fact that we observed platelet granule secretion at the edge of the platelet plug may also explain why we observed a significant decrease in fibrin accumulation in F12−/−mice. As shown by Chaudhry et al, platelets store and secrete very high levels of Zn2+, an essential cofactor of FXII.51 The Zn2+ concentration in platelet α-granules is ∼25-fold to 60-fold higher than in plasma, and it was shown that platelet activation and granule release contribute to thrombin/fibrin generation and alter fibrin structure in vitro.52,53 Consistent with this result, we observed fibrin accumulation in areas of platelet granule release and PS exposure. Interestingly, Darbousset et al found no effect on fibrin accumulation in F12−/−mice in the cremaster arteriole laser injury model.54 The authors suggested that neutrophil TF provides a critical source of intravascular coagulation activity, which would explain why FXII was less important in their experimental conditions.
In summary, we report on a 4D imaging platform to visualize and quantitatively assess hemostatic plug formation in mice. Using this platform in combination with genetically modified mice, we demonstrate that platelets are the main procoagulant surface contributing to fibrin formation/accumulation within the plug. Our studies suggest that ECs immediately surrounding the injury area also contribute to fibrin formation but that this procoagulant activity is offset by rapid Plg recruitment and consequent fibrinolysis.
Acknowledgments
The authors thank Peter Nigrovic (Brigham and Women’s Hospital) for use of cell lineage tracer mice, and Steven Grover for helpful discussions.
This work was supported by the National Institutes of Health, National Heart, Lung, and Blood Institute (grants R35 HL144976 and P01 HL151433 [W.B.], F31HL165935-01 [A.B.-K.], R35 HL155657 [N.M.], RO1 HL157441 [R.P.], and R01 HL 160046 and U01 HL14303 [M.J.F.]). P.Y.K. holds the Department of Medicine Mid-Career Award (McMaster University).
Authorship
Contribution: A.B.-K. and R.H.L. designed research, performed research, analyzed data, and wrote manuscript; E.C.O. analyzed data; S.R.J. performed research; P.Y.K., R.P., N.M., and M.J.F. provided vital reagents or mice, and provided valuable insights; D.S.P. performed research; D.A.A. generated and provided data analysis software; and W.B. designed research and wrote the manuscript.
Conflict-of-interest disclosure: D.A.A. is the owner of Visual Data Tools Inc, developer of ImageTank and DataGraph. The remaining authors declare no competing financial interests.
Correspondence: Wolfgang Bergmeier, The University of North Carolina at Chapel Hill, 116 Manning Dr, 8212A Mary Ellen Jones Building, Chapel Hill, NC 27599; email: bergmeie@email.unc.edu.
References
Author notes
Data are available from the corresponding author, Wolfgang Bergmeier (bergmeie@email.unc.edu), on request.
The online version of this article contains a data supplement.
There is a Blood Commentary on this article in this issue.
The publication costs of this article were defrayed in part by page charge payment. Therefore, and solely to indicate this fact, this article is hereby marked “advertisement” in accordance with 18 USC section 1734.

![PS exposure potentiates fibrin accumulation around the platelet plug. (A-B) Surface view for accumulation of PS (red [aV]; left panel), fibrin (blue; right panel), and platelets (gray) at the indicated time points during hemostatic plug formation in WT (A), and CypD−/−mice (B). (C-E) SFI ± SEM over time for PS (CypD−/−, n = 7 injuries in 3 mice; and WT, n = 8 injuries in 3 mice) (C), fibrin (CypD−/−, n = 27 injuries in 3 mice; and WT, n = 19 injuries in 3 mice) (D), and platelets (CypD−/−, n = 27 injuries in 3 mice and WT, n = 20 injuries in 3 mice) (E). Same WT controls as in Figure 2. Statistical significance was determined for fluorescence signals of the last 3D stack acquired during the observation period. ns, not significant; ∗P < .01; ∗∗∗P < .001. Scale bar indicates 50 μm.](https://ash.silverchair-cdn.com/ash/content_public/journal/blood/144/10/10.1182_blood.2023022608/2/m_blood_bld-2023-022608-gr5.jpeg?Expires=1770585580&Signature=iShe23RXi5r7JwXsiL0s5FaE425Yv48nNSWYtE8bQdWgZhZm96jckcAyVd8yLdCdcsk2xWvJmAtHHW3ExZlq9jo3~sLs5k~mLSC2CMZ3z1tt-eAXU2cN8IIEXAiZHFWKnw0U~wSVp~NQNadBCe6uiEqacLze-inRdQh0PbdR9Qum9gitsDs-R-5ruOVhx-d4kK44KbXIyxsQdTzPhCe70J-VTvH~0Si5eG2YKw2xwpBN1MFNIoPa~8OeO7IV57h7fEs6Wm9Jb~WZUasA0zkNZp1t0-cayxHcZ0uMTh05iVoDLhCzyTaWUuwGjMZSfaKvGMx0TcrzwE1sl9hFZBySjg__&Key-Pair-Id=APKAIE5G5CRDK6RD3PGA)

![PS exposure potentiates fibrin accumulation around the platelet plug. (A-B) Surface view for accumulation of PS (red [aV]; left panel), fibrin (blue; right panel), and platelets (gray) at the indicated time points during hemostatic plug formation in WT (A), and CypD−/−mice (B). (C-E) SFI ± SEM over time for PS (CypD−/−, n = 7 injuries in 3 mice; and WT, n = 8 injuries in 3 mice) (C), fibrin (CypD−/−, n = 27 injuries in 3 mice; and WT, n = 19 injuries in 3 mice) (D), and platelets (CypD−/−, n = 27 injuries in 3 mice and WT, n = 20 injuries in 3 mice) (E). Same WT controls as in Figure 2. Statistical significance was determined for fluorescence signals of the last 3D stack acquired during the observation period. ns, not significant; ∗P < .01; ∗∗∗P < .001. Scale bar indicates 50 μm.](https://ash.silverchair-cdn.com/ash/content_public/journal/blood/144/10/10.1182_blood.2023022608/2/m_blood_bld-2023-022608-gr5.jpeg?Expires=1770702662&Signature=YETlAvIeWygIqkDcj2z4PIyCZTqadRrWu97JHM7Hq8pCizVDmJPtSIf3CLydR5vXKizBglOsJ7RuyhTPDL3EnnHmrTUF5JtFkZ40fFJcuAzw2wdh6j87AqFv97MT8kTpGDq2czx~lZXwvBm5ik37fGivNDpe1Ov7NB9A8iR0gb5BKsPG~gjinnt8D1m1TMCEpNjdoSa-~dPmhYNkS4PVpRbSusMWjaRTGnXYdkii6IV7oEtKM3eC8gh5l5-nMPFUPEHEXsUPmrQF5JBuCbvCEXlIF8J0MTBZSaTGsWTmvJX4Ap7TBZt43ulp1UfgZ53uBUSyQiNNSm6QBAROMg0MfQ__&Key-Pair-Id=APKAIE5G5CRDK6RD3PGA)
