Abstract
The molecular mechanisms that regulate asymmetric divisions of hematopoietic progenitor cells (HPCs) are not yet understood. The slow-dividing fraction (SDF) of HPCs is associated with primitive function and self-renewal, whereas the fast-dividing fraction (FDF) predominantly proceeds to differentiation. CD34+/CD38– cells of human umbilical cord blood were separated into the SDF and FDF. Genomewide gene expression analysis of these populations was determined using the newly developed Human Transcriptome Microarray containing 51 145 cDNA clones of the Unigene Set-RZPD3. In addition, gene expression profiles of CD34+/CD38– cells were compared with those of CD34+/CD38+ cells. Among the genes showing the highest expression levels in the SDF were the following: CD133, ERG, cyclin G2, MDR1, osteopontin, CLQR1, IFI16, JAK3, FZD6, and HOXA9, a pattern compatible with their primitive function and self-renewal capacity. Furthermore, morphologic differences between the SDF and FDF were determined. Cells in the SDF have more membrane protrusions and CD133 is located on these lamellipodia. The majority of cells in the SDF are rhodamine-123dull. These results provide molecular evidence that the SDF is associated with primitive function and serves as basis for a detailed understanding of asymmetric division of stem cells.
Introduction
Stem cells are characterized by their dual abilities to self-renew and to differentiate into progenitors of various lineages. Using hematopoietic stem cells (HSCs) as a model, these characteristics have been used to define stem cells for over 40 years, but the knowledge of the processes involved in regulating self-renewal versus differentiation is still only rudimentary.1 Several surrogate markers and assay systems have been developed, but all in vitro systems have failed to definitively identify the ultimate HSCs. The CD34+/CD38– immunophenotype seems to be associated with a primitive population in human bone marrow and cord blood.2,3 Further enrichment of HSCs might be achieved by selection for other phenotypic markers such as Thy-1, HLA-DR, CD133, c-kit, or rhodamine-123dull.4-8 However, there is no appropriate phenotypic constellation that permits us to isolate a pure and homogenous population of HSCs.
Provided with knowledge gained in genomics in the past few years, gene expression analysis of hematopoietic progenitor cells (HPCs) could help to reveal the molecular mechanisms that are involved in self-renewal or differentiation.9-15 To determine the distinct molecular characteristics of multipotent HPCs, it is necessary to enrich pure cell populations with the dual ability of self-renewal and differentiation.15 This dual ability implies that stem cells undergo at some stage during the development asymmetric divisions, resulting in daughter cells with different long-term fate. Previous work of our and other groups has shown that asymmetric cell division of HPCs coincided with primitive function. Using time-lapse microscopy recording and continuous image analysis systems, we have correlated the symmetry of HPC divisions with their long-term fate at a single-cell level. We observed that about 30% of CD34+/CD38– cells, irrespective of source (ie, from fetal liver, umbilical cord blood, or adult bone marrow), gave rise to a daughter cell that remained quiescent over 8 days, whereas the other daughter cell proliferated exponentially.16 At a single-cell level, the primitive myeloid-lymphoid–initiating cells (ML-ICs) were only found in quiescent or slow-dividing fractions (SDFs).17,18 Other authors have also demonstrated that most primitive stem cells were quiescent or had low cycling rates,19,20 and that most of the CD34+/CD38– cells analyzed directly after their isolation from the bone marrow remained quiescent.21 In the nonobese diabetic/severe combined immunodeficient (NOD/SCID) mouse model, quiescent cells residing in G0 had a significantly higher repopulating capacity than the proliferating fraction.22,23 Thus, separation of the slow-dividing subfraction within the CD34+/CD38– population could further enrich cells associated with primitive function and asymmetric division. We and others have demonstrated that the membrane dye PKH26 could be exploited to assist in isolation of the quiescent or SDF.16,24-26
In continuation with this line of research, the CD34+/CD38– cells were separated into an SDF and a fast-dividing fraction (FDF). Global gene expression profiles for these 2 populations were analyzed and compared using the recently developed novel Human Transcriptome Microarray (U.W., Christian Maercher, Mechthild Wagner, J. S., Heiko Drzoriek, Uwe Radelof, A. A., C. S., Bernhard Korn, and W. A., manuscript in preparation) with 51 145 UnigeneSet-RZPD3 cDNA clones. To obtain additional information on primitive versus committed progenitor cells, the gene expression profile of CD34+/CD38– cells, which are associated with more primitive function, was analyzed and compared with that of the CD34+/CD38+ cells that are committed to differentiation.
Material and methods
Cell isolation
Human cord blood (CB) was collected from the umbilical cord after informed consent was obtained from the patient, using guidelines approved by the Ethics Committee on the Use of Human Subjects at the University of Heidelberg. Mononuclear cells (MNCs) were isolated after centrifugation on Ficoll-Hypaque (Biochrom, Berlin, Germany). CD34+ cells were enriched with a monoclonal anti-CD34 antibody labeled with magnetic beads on an affinity column (Miltenyi Biotec, Bergisch-Gladbach, Germany). CD34+-enriched cells were incubated with anti–CD34-phycoerythrin (PE; Becton Dickinson, San Jose, CA) and anti–CD38-allophycocyanin (APC; Becton Dickinson). The cells were washed in phosphate-buffered saline (PBS) and 10% fetal calf serum (FCS) and stained with propidium iodide (PI) to identify dead cells. CD34+/CD38– and CD34+/CD38+ populations were sorted using the automatic cell-depositing unit on a fluorescence-activated cell sorting (FACS)–Vantage-SE flow cytometry system (Becton Dickinson, San Jose, CA). Cells positive for PI were excluded. The subpopulations were either used directly for gene expression profiling or labeled with the membrane dye PKH26 (Sigma, St Louis, MO) to monitor cell proliferation. The labeled cells were cultured for 7 days in Myelocult (Stem Cell Technology, Vancouver, BC, Canada) in 24-well plates (Nunc, Roskilde, Denmark). The medium was supplemented with 2.5 U/mL recombinant human erythropoietin (Roche, Hertfordshire, United Kingdom), 10 ng/mL recombinant human interleukin 3 (IL-3), 500 U/mL recombinant human IL-6, 10 ng/mL recombinant human granulocyte-macrophage colony-stimulating factor, 2.5 ng/mL recombinant human basic fibroblast growth factor, 10 ng/mL recombinant human insulin-like growth factor 1, 50 ng/mL recombinant human stem cell factor, 2.5 ng/mL fibroblast growth factor β, 1000 U/mL penicillin, and 100 U/mL streptomycin (Gibco, Grand Island, NY) as described previously.16 Cytokines were purchased from R&D Systems (Minneapolis, MN). Cells were resorted according to their PKH26 staining after 7 days.
RNA isolation and probe synthesis
About 5 × 10⁴ cells from each fraction were lysed and total RNA isolated using the Acturus PicoPure RNA isolation kit (Acturus, Mountain View, CA). DNase treatment was performed (Quiagen, Hilden, Germany). RNA quality was controlled with the RNA 6000 Pico LabChip kit (Agilent, Waldbronn, Germany). Linear amplification of mRNA was performed by in vitro transcription over 2 rounds using the Arcturus RiboAmp kit (Acturus). The aRNA was analyzed by the RNA nano LabChip kit (Agilent) and by the SpectraMAX plus photometer (Molecular Devices, Sunnyvale, CA) at 260 nm. We obtained about 130 μg aRNA with a continuous spectrum of RNA length of 200 to 700 bp (results not shown). About 25 μg aRNA was incubated with 3 μg random primer (Invitrogen, Karlsruhe, Germany) and labeled by amino-allyl-coupling using the Atlas Glass Fluorescent Labeling Kit (Clontech, Palo Alto, CA) and Cy3/Cy5-monofunctional reactive dye (Amersham Biosciences, Little Chalfont, United Kingdom).
The Human Transcriptome Microarray
A novel cDNA microarray was used that represents the UnigeneSet-RZPD3 composed of 51 145 clones, a very well-characterized subset of the IMAGE cDNA clone collection (http://image.llnl.gov/image). Sequence information and clones are available at the Resource Center and Primary Database (RZPD, Berlin, Germany). Selection of the clones was based on the human Unigene clusters of the National Center for Biotechnology Information (NCBI; http://www.ncbi.nlm.nih.gov/entrez/query.fcgi?db=unigene). The inserts are selected to be located close to the 3′ end of the cDNA and to have a length between 500 and 1200 bp. All clones have been sequence verified. A total of 42 000 of the 45 000 successfully resequenced clones are associated with ENSEMBL or LocusLink gene predictions. The cDNA inserts were amplified with a pair of NH2-modified flanking universal primers. The polymerase chain reaction (PCR) products were purified on a Biomek FX Robot (Beckman Coulter, Krefeld, Germany) using the Macherey-Nagel Nucleospin kit. The purified fragments were analyzed on a buffer-free ready-to-run agarose gel system (RTR; Amersham/Pharmacia, Freiburg, Germany). Gels were loaded by a Biomek 2000 robot (Beckman Coulter) and band patterns analyzed by the EMBL “ChipSkipper” software (C. Schwager, EMBL, Heidelberg, Germany). Over 96% of the inserts could be amplified and showed a single band pattern. The spotting was performed on a GeneMachines OmniGrid spotter with 48 split needles (Arraylt, Sunnyvale, CA) depositing the clone set on 2 epoxy slides. Further details about the techniques used have been described before.27,28
Hybridization of the slides
The slides were immersed at 42° C in 6 × standard saline citrate (SSC)/0.5% sodium dodecyl sulfate (SDS)/1% bovine serum albumin (BSA) for 40 minutes and carefully washed in ddH2O at room temperature. The attached PCR products were then denatured at 95° CinddH2O for 2 minutes and then air dried. Prior to hybridization, the purified Cy3/Cy5-labeled cDNA probes were mixed together. Then, 20 μg poly-d-A and 20 μg human Cot1DNA (both Gibco Invitrogen, Carlsbad, CA) were added and the mixture evaporated in the Vacuum Concentrator 5301 (Eppendorf, Hamburg, Germany) at 60° C to complete dryness. The pellet was dissolved in 50 μL hybridization buffer (50% formamide/6 × SSC/0.5% SDS/5 × Denhardt) and denatured by incubating at 95° C for 2 minutes. The probe was hybridized with the microarray in a humid chamber in a water bath at 42° C for 16 hours. After hybridization, slides were washed in 0.1 × SSC/0.1% SDS for 10 minutes and then twice with 0.1 × SSC for 5 minutes at 37° C with 130 rpm on an orbital shaker (Gio Gyrotory Shaker, New Brunswick Scientific, Edison, NJ). Slides were dried by a brief centrifugation at 715 g in a microtiter plate centrifuge (Z320; Hermle, Wehingen, Germany) and scanned immediately.
Analysis of results
Slides were scanned at a 10-μm resolution using the GenePix 4000B Microarry-Scanner (Axon Instruments, Union City, CA). Individual laser power and photomultiplier settings were used, allowing all signals to remain in the linear range of the scanner. Separate images for Cy3 and Cy5 were produced and analyzed by the ChipSkipper Microarray Data Evaluation Software (http://chipskipper.embl.de). Integration grids were automatically centered to the images. For each spot total intensity and local background were calculated. Raw ratios were derived from background reduced signals. Normalization was performed by intensity-dependent windowed median ratio centering. The resulting data were further analyzed by Excel (Microsoft, Redmond, WA). The ratio of differential gene expression is presented as the mean of Log2 values from all replicate and color-flip hybridizations (Log2 ratio). Genes with mean Log2 expression greater than 1 were selected as those that show a significant expression ratio across the replicated data sets. Further filtering was performed with replica standard deviation (SD). We have considered several methods for the statistical analysis including statistical analysis for microarrays (SAMs), which was developed to analyze a treated versus an untreated set (as a reference) with single-color arrays.29 For our experimental design we have chosen the 2-tailed, paired Student t test to estimate the probability of each filtered gene to be part of the broad distribution of all genes in the 4 (CD34+CD38–/CD34+CD38+) or 6 data sets (SDF/FDF). False discovery rate (FDR) was estimated by simulations. Using a pure gaussian distributed set of replicated hybridizations (generated with Monte Carlo methods) no false-positive genes could be detected with our filtering method. Taking into account that real data sets contain a biologic bias, a second simulation was performed. Stochastic permutations of all experimental ratio values from the replicated hybridizations were used to create sets of experimental but not correlated virtual replications. Ten thousand simulations were performed and the average number of genes within the filter criteria was given as FDR.
The complete microarray data including the description of all spotted genes (according to Minimal Information About Microarray Experiments, MIAME requirements30 ) is submitted to the public microarray database ArrayExpress (http://www.ebi.ac.uk/arrayexpress/query/entry, accession number E-EMBL-1).
Comparison with other databases
Murine and human sequences were compared in a similar way as described previously.9 Homologous genes were identified by identical Unigene names. Then sequences from the UnigeneSet-RZPD3 clone set were blasted against release 8 of the mouse Database of Transcription (http://www.cbil.upenn.edu/downloads/DoTS) using an e-value cutoff of 1e-15. Identified sequences were further verified by tblastx using an e-value cutoff of 1e-10. Accession numbers from DoTS transcript were used to map to Unigene clusters. These clusters were cross-referenced against mouse genes, reported to be enriched in the stem cell fractions.
RT-PCR analysis
To further support the information obtained from the microarray data, real-time reverse transcription-PCR (RT-PCR) analysis was carried out with LightCycler technology (Roche Molecular Biochemicals, Mannheim, Germany). About one twentieth of total RNA isolated as described (see “RNA isolation and probe synthesis”) was reverse transcribed by Superscript II (Gibco Invitrogen). Semiquantitative PCR was performed with the LightCycler Master SYBR Green kit (Roche Molecular Biochemicals) with 3 mM MgCl at 480 seconds of preincubation at 95° C followed by 50 cycles of 10 seconds at 55° C, 25 seconds at 72° C, and 10 seconds at 95° C. PCR products were subjected to melting curve analysis and to conventional agarose gel electrophoresis to exclude synthesis of unspecific products. The following primers were used: 18s rRNA primers supplied by Ambion (Austin, TX): 18s rRNA forward primer: 5′-TCAAGAACGAA AGTCGGAGG-3′; 18s rRNA reverse primer: 5′-GGACATCTAA GGGCATCACA-3′; GAPDH forward primer: 5′-ATGGCACCGT CAAGGCTGAG A-3′; GAPDH reverse primer: 5′-GGCATGGACT GTGGTCATGA G-3′; ubiquitin forward primer: 5′-TGCAGAGTAA TGCCATCACTG-3′; ubiquitin reverse primer: 5′-CAAGATAAAG AAGGCATCCC C-3′; CD133 forward primer: 5′-ACATGAAAAG ACCTGGGGG-3′; CD133 reverse primer: 5′-GATCTGGTGT CCCAGCATG-3′; HLA-A forward primer: 5′-ACGACGGCAA GGATTACATC-3′; HLA-A reverse primer: 5′-GCTTCATGGT CAAGAGACAG C-3′; γ-globin forward primer: 5′-TTGAAAGCTC TGAATCATGG G-3′; γ-globin reverse primer: 5′-CTTCAAGCTC CTGGGAAATG-3′; CD36 forward primer: 5′-TTTATGAGGC GATTATGACAG C-3′; CD36 reverse primer: 5′-AGTTGCAACT TACGCTTGGC-3′; cadherin 1 forward primer: 5′-TGTTTTCCTT TTCCACCCC-3′; and cadherin 1 reverse primer: 5′-ACCCTGCAAT CACTTTTTGG-3′. Primers were designed within the sequences represented on the Human Transcriptome Microarray and synthesized by Biospring (Frankfurt, Germany). The amplification efficiency of PCR products was determined by calculating the slope after semilogarithmic plotting of the values against cycle number as described before.31 At least 3 independent total RNA samples were analyzed and differential expression calculated in relation to 18s rRNA.
Rhodamine assay
Efflux of the fluorescent dye rhodamine-123 (Rh-123) resolves functionally distinct subsets of HSCs.32,33 Cells were washed and resuspended in growth medium as described (see “Cell isolation”) containing 0.2 μg/mL Rh-123 (Sigma-Aldrich, Deisenhofen, Germany). After an incubation period of 30 minutes, cells were centrifuged and resuspended in growth medium (see “Cell isolation”). Cells were incubated at 37° C for 60 minutes to allow the efflux of Rh-123. Then the cells were washed twice in PBS and 10% FCS and analyzed by flow cytometry. Additional controls were performed with 1.5 μM of the P-glycoprotein inhibitor cyclosporin A (Novartis, Basel, Switzerland) in all steps.
Immunofluorescence
An Olympus IX70 microscope (Olympus Optical, Hamburg, Germany) was used to assess the fluorescence and morphology of the PKH26+/– cells. For simultaneous analysis of CD133 and PKH26, the antibodies CD133/1 pure antibody (Miltenyi Biotec) and the Alexa Fluor-488 antimouse secondary antibody (Molecular Probes, Eugene, OR) were used, and analysis was performed with a dual-band filter fluorescein isothiocyanate (FITC)/Cy3 (AHF Analysetechnik, Tübingen, Germany). Artificial capping of the antigen to membrane protrusions was excluded by additional fixation with 4% formaldehyde. The proportion of irregular cells with membrane protrusions was calculated by random choice of 5 different fields (× 20 objective) of each condition and direct counting of total cells (400-500).
Results
Isolation of HPCs
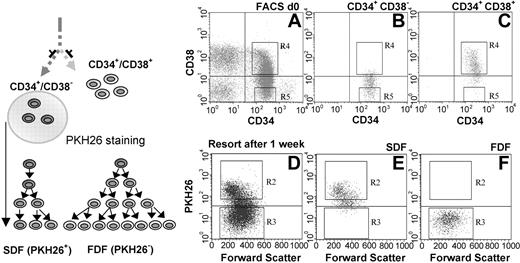
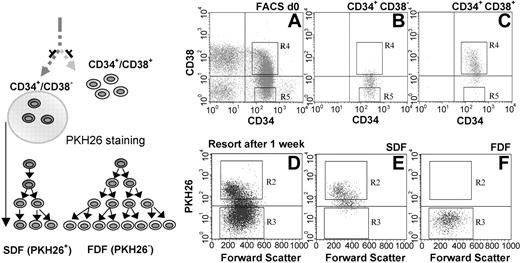
The CD34+/CD38– fraction and the CD34+/CD38+ fraction were isolated from human umbilical CB. We then separated the CD34+/CD38– population into an SDF and an FDF. CD34+/CD38– cells were labeled with the fluorescent dye PKH26 to assist this separation. During 1 week of in vitro cultivation in the medium, this dye was diluted after every cell division and distributed equally to the daughter cells. The SDF could then be isolated as PKH26+ and the FDF as PKH26–. Reanalysis of the isolated cells revealed a purity of 95% to 99% in both populations (Figure 1). Previous experiments from our group have demonstrated that approximately 30% of the CD34+/CD38– cells divide slowly and asymmetrically and this divisional behavior is associated with primitive function.16,18
Separation of CD34+/CD38– cells into SDF and FDF. CD34+/CD38– and CD34+/CD38+ subpopulations were isolated from human CB (A). Reanalysis of the sorted cells confirmed the efficient separation of these cell fractions (B-C). The CD34+/CD38– stem cell population was then stained with PKH26 and cultivated for 1 week. The SDF (PKH26+) was separated by cell sorting form the FDF (PKH26–) population (D). Efficient enrichment was controlled by reanalysis (E-F).
Separation of CD34+/CD38– cells into SDF and FDF. CD34+/CD38– and CD34+/CD38+ subpopulations were isolated from human CB (A). Reanalysis of the sorted cells confirmed the efficient separation of these cell fractions (B-C). The CD34+/CD38– stem cell population was then stained with PKH26 and cultivated for 1 week. The SDF (PKH26+) was separated by cell sorting form the FDF (PKH26–) population (D). Efficient enrichment was controlled by reanalysis (E-F).
Gene expression profiles: CD34+/CD38– versus CD34+/CD38+
The CD34+/CD38– fraction is enriched in primitive HPCs. In our experiments the gene expression profile of this population was determined in comparison to the more committed CD34+/CD38+ population. For each population, 2 independent RNA pools were analyzed. Each of these RNA pools was a combination of 3 total RNA samples isolated from 3 individual CBs pooled prior to amplification. Direct and corresponding color-flip experiments were carried out to compensate for any dye-specific effects, resulting in a total of 4 cohybridization data sets. Hybridizations of the Human Transcriptome Microarray with RNA samples from CD34+/CD38– and CD34+/CD38+ cells resulted in reproducible signal intensities and expression patterns.
Ninety-six spots showed a more than 2-fold (Log2 ratio > 1, SD < 1, FDR = 12) higher signal in the CD34+/CD38– stem cell fraction. Among these were 27 functionally characterized genes summarized in Table 1.
In contrast, 119 spots showed at least a 2-fold (Log2 ratio <–1, SD < 1, FDR = 27) higher signal in the CD34+/CD38+ population. Among these were 38 functionally characterized genes (Table 2).
Gene expression profile: SDF versus FDF
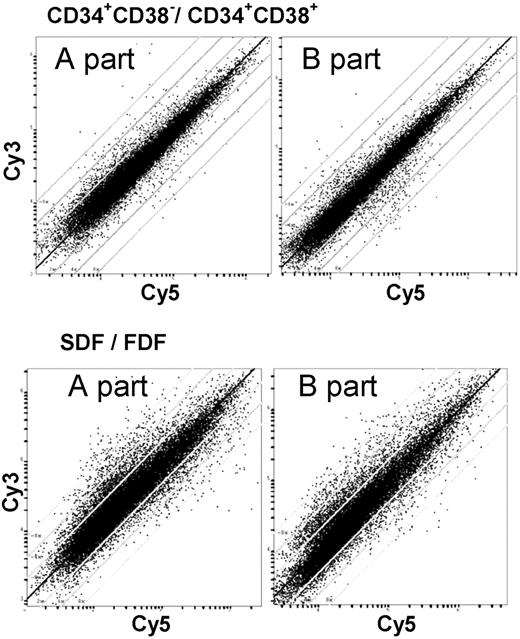
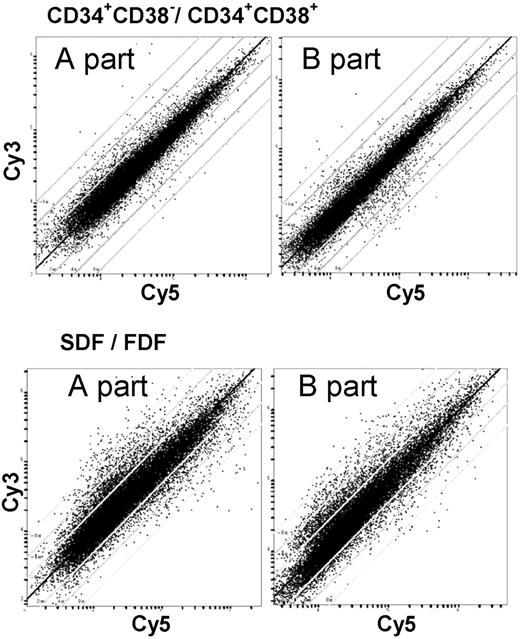
The SDF within the CD34+/CD38– population is associated with asymmetric cell division and multipotent ML-IC activity. We have determined the gene expression profile of the SDF in comparison to the FDF for 3 individual CB samples separately. Corresponding color-flip experiments were performed, resulting in 6 cohybridization data sets. Global gene expression survey by scatter plot analysis revealed that a large proportion of genes was differentially regulated in the 2 populations. Comparative analysis with respect to the CD34+/CD38– versus CD34+/CD38+ populations showed repeatedly additional heterogeneity of signals. This corresponds most probably to the greater biologic differences between the SDF and FDF populations (Figure 2).
Global gene expression survey with the Human Transcriptome Microarray. The Human Transcriptome Microarray is composed of over 51 145 ESTs of the UnigeneSet-RZPD3. This set of PCR-amplified clones was spotted on 2 slides. The scatter plots show the relative signal intensities of the red and green channel of representative experiments. This allows global survey of differential gene expression. Lines indicate 2-, 4-, and 8-fold difference in the relative signal intensity. The 2 corresponding scatter plots represent the 2 parts of the Human Transcriptome Microarray of the same hybridization experiment. The observed differential gene expression varied more in the SDF versus FDF in comparison to CD34+/CD38– versus CD34+/CD38+.
Global gene expression survey with the Human Transcriptome Microarray. The Human Transcriptome Microarray is composed of over 51 145 ESTs of the UnigeneSet-RZPD3. This set of PCR-amplified clones was spotted on 2 slides. The scatter plots show the relative signal intensities of the red and green channel of representative experiments. This allows global survey of differential gene expression. Lines indicate 2-, 4-, and 8-fold difference in the relative signal intensity. The 2 corresponding scatter plots represent the 2 parts of the Human Transcriptome Microarray of the same hybridization experiment. The observed differential gene expression varied more in the SDF versus FDF in comparison to CD34+/CD38– versus CD34+/CD38+.
In the SDF, a total of 942 spots showed at least a 2-fold higher signal (Log2 ratio > 1, FDR = 39). The 36 genes that were more than 4-fold overexpressed in the SDF are summarized in Table 3 (Log2 ratio > 2, FDR = 0). Many genes of the HLA cluster, the homeodomain protein HOXA9 (3.9-fold), frizzled 6 (2.2-fold), and JAK3 (2.3-fold) were also highly expressed in the SDF.
A total of 794 spots showed a more than 2-fold higher signal in the FDF (Log2 ratio <–1, FDR = 61). Table 4 displays the 18 genes that had a more than 4-fold higher expression in the FDF (Log2 ratio <–2, FDR = 0).
Combination of gene expression profiles
The differential gene expression profiles of CD34+/CD38– versus CD34+/CD38+ cells and of SDF versus FDF were compared. A total of 55 spots showed at least a 1.8-fold higher expression in both more primitive progenitor cell fractions (CD34+/CD38– and SDF, Log2 ratio > 0.85, FDR = 3), whereas 45 spots showed higher expression in the 2 more committed fractions (CD34+/CD38+ and FDF, Log2 ratio <–0.85, FDR = 2). Tables 5 and 6 summarize a selection of those genes.
Various groups have used microarray approaches before to determine gene expression profiles in different fractions of murine and human HSCs. To further narrow down the candidate genes that are predominantly expressed in HSCs, we compared our results to 3 microarray approaches9,10,15 and analyzed the overlap (Table 7). A global comparison of the results is difficult due to differences in starting cell material, in methods (cell preparations, RNA amplification, RNA labeling, microarray design, and hybridization methods), and in the annotation of genes and data analysis. However, several genes that were up-regulated in the CD34+/CD38– fraction or in the SDF have also been up-regulated in other fractions of HSCs. Among the genes that were prominently overexpressed in these studies were HOXA9, frizzled 6 (FZD6), MDR1, RNA-binding protein with multiple splicing (RBPMS), PR-domain zinc finger protein 1 (PRDM1), and Janus kinase 3(JAK3).
Data supporting the microarray results
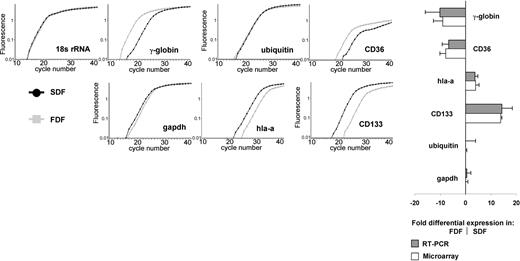
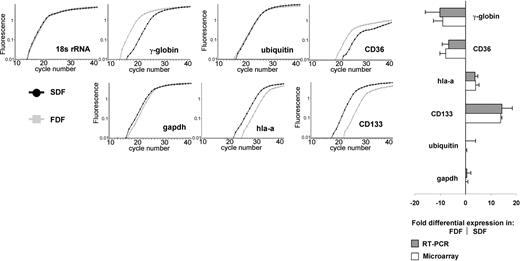
We have validated the expression of several genes in the FDF and SDF by semiquantitative RT-PCR. In accordance to the microarray analysis, GAPDH and ubiquitin showed no differential expression in these populations; CD133 and HLA-A showed higher expression in the SDF, whereas γ-globulin, CD36, and e-cadherin (RT-PCR product only in FDF) were more highly expressed in the FDF. As expected, CD38 shows a higher expression in the CD34+/CD38+ population in microarray analysis (4.0 ± 1.2-fold) and in flow cytometry (14.3 ± 1.1-fold). We further analyzed the expression of CD34 and CD38 in the SDF and FDF by flow cytometry. In accordance with our microarray results the SDF revealed higher expression of CD34 (FACS, 3.4-fold; microarray, 1.4 ± 0.5-fold) and of CD38 (FACS, 3.8-fold; microarray, 3.0 ± 1.7-fold). Both the RT-PCR as well as the FACS techniques confirmed our microarray results on the genes studied (Figure 3).
Confirmation of differential expression by real-time RT-PCR. Semiquantitative RT-PCR by LightCycler analysis was used to verify differential gene expression of 7 genes in FDF and SDF in relation to 18s rRNA. HLA-A and CD133 were higher expressed in the SDF. γ-Globin, CD36, and cadherin-e (not shown) were more highly expressed in the FDF. GAPDH and ubiquitin did not show significant differential expression and were used as additional controls. All figures belong to the same run of 1 RNA sample. A high correlation between RT-PCR and microarray analysis was observed. Error bars represent SD of at least 3 experiments.
Confirmation of differential expression by real-time RT-PCR. Semiquantitative RT-PCR by LightCycler analysis was used to verify differential gene expression of 7 genes in FDF and SDF in relation to 18s rRNA. HLA-A and CD133 were higher expressed in the SDF. γ-Globin, CD36, and cadherin-e (not shown) were more highly expressed in the FDF. GAPDH and ubiquitin did not show significant differential expression and were used as additional controls. All figures belong to the same run of 1 RNA sample. A high correlation between RT-PCR and microarray analysis was observed. Error bars represent SD of at least 3 experiments.
Slow-dividing stem cells have distinct morphology
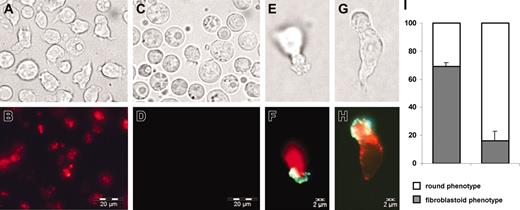
Microscopic observation and flow cytometry demonstrated that cells of the SDF appeared to be smaller than those in the FDF. In the SDF the majority of cells (69% ± 3%) displayed a fibroblastoid, elongated phenotype, whereas in the FDF the majority of cells have a round phenotype and only 16% ± 7% showed membrane protrusions (observed in > 9 independent experiments). Anti-CD133 monoclonal antibody revealed expression of prominin in the SDF especially on the tip of plastic adherent lamellipodia. In contrast, the FDF showed less podia formation and low prominin expression (Figure 4).
SDF has fibroblastoid morphology. The SDF (A-B) and the FDF (C-D) were separated according to their PKH26 staining after 1 week. Cells in the SDF are on average smaller; 69% of them revealed membrane protrusions. In contrast, cells in the FDF had a round morphology and only 16% displayed podia formation. CD133 (prominin) is more strongly expressed in the SDF and accumulates at the tip of lamellipodia (E-F; G-H; red = PKH26; green = CD133). Error bars represent SD. Cells were observed with a 40× immersion objective (40× HI; Olympus Optical, Hamburg, Germany), microscope model IX-70 (Olympus Optical) connected to a video camera (Colorview XS; Soft Images Systems, Münster, Germany; resolution: pixel size 6.7 × 6.7 μm; NA of 40 × objective: 1.0).
SDF has fibroblastoid morphology. The SDF (A-B) and the FDF (C-D) were separated according to their PKH26 staining after 1 week. Cells in the SDF are on average smaller; 69% of them revealed membrane protrusions. In contrast, cells in the FDF had a round morphology and only 16% displayed podia formation. CD133 (prominin) is more strongly expressed in the SDF and accumulates at the tip of lamellipodia (E-F; G-H; red = PKH26; green = CD133). Error bars represent SD. Cells were observed with a 40× immersion objective (40× HI; Olympus Optical, Hamburg, Germany), microscope model IX-70 (Olympus Optical) connected to a video camera (Colorview XS; Soft Images Systems, Münster, Germany; resolution: pixel size 6.7 × 6.7 μm; NA of 40 × objective: 1.0).
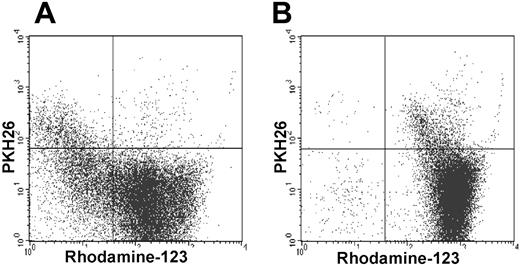
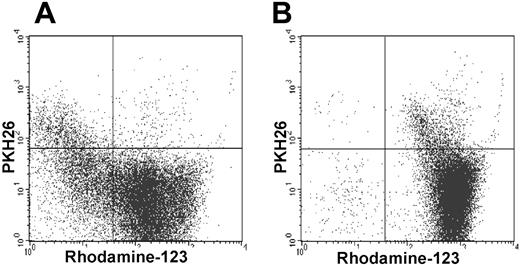
The fluorescent dye Rh-123 can resolve functionally distinct subsets of HSCs. The majority of cells in the SDF were able to efflux Rh-123 in contrast to most cells in the FDF that remained stained with Rh-123. Under exposure to the P-glycoprotein inhibitor cyclosporin (CsA), this efflux effect was blocked (Figure 5).
SDF can efflux Rh-123. The vast majority of the SDFs (PKH26+) can efflux Rh-123, whereas the FDFs (PKH26–) were stained as Rh-123high (A). With the inclusion of the P-glycoprotein inhibitor cyclosporin (CsA) efflux of Rh-123 in the SDF was effectively blocked (B; representative for 3 experiments).
SDF can efflux Rh-123. The vast majority of the SDFs (PKH26+) can efflux Rh-123, whereas the FDFs (PKH26–) were stained as Rh-123high (A). With the inclusion of the P-glycoprotein inhibitor cyclosporin (CsA) efflux of Rh-123 in the SDF was effectively blocked (B; representative for 3 experiments).
Discussion
In this study we have described the transcriptional and cellular characteristics of a hematopoietic progenitor population that has been enriched by exploiting differential division kinetics. Genomewide analysis supports the notion that the SDF of CD34+/CD38– cells is associated with primitive stem cell function.
To fulfill their dual function of self-renewal as well as differentiation into progenitors of multiple blood cell lineages, HPCs must undergo asymmetric divisions during development to sustain long-term hematopoiesis as well as to produce the various progeny cells of the different lineages. In previous experiments we have monitored early cell divisions of HPCs and related them directly to long-term fate of the daughter cells at a single-cell level, confirming that asymmetric division kinetics correlates with primitive stem cell function.16,18,34 Cells giving rise to primitive ML-ICs demonstrated significantly slower division kinetics than those giving rise to committed progenitors. Furthermore, it was shown that maintenance of self-renewal and primitive function could only be influenced by direct contact with AFT024-feeder layer, which elevated the proportion of cells undergoing asymmetric divisions.34
To identify the genes involved in asymmetric division a Human Transcriptome Microarray was used. This microarray allowed the expression analysis of nearly all human transcripts isolated thus far. The complete human genome contains an estimated 30 000 to 40 000 different genes. Only about 20 000 genes are allocated and an even smaller number is functionally characterized today.35 The Human Transcriptome Microarray used is to our knowledge the largest cDNA microarray today (51 145 expression sequence tags [ESTs]) that is estimated to represent about 95% of human genes with a well-characterized clone selection.36,37 The results of gene expression analysis were confirmed by corresponding semiquantitative RT-PCR results for several selected genes as well as by immunofluorescence and flow cytometry. This new powerful tool will facilitate the identification of relevant and differentially expressed genes and gene families that are involved in fundamental life processes.
In a first step, the gene expression profiles of relatively primitive CD34+/CD38– cells versus committed CD34+/CD38+ cells were compared. As derived from the similarities in gene expression profiles, the CD34+/CD38– and CD34+/CD38+ fractions represent closely related samples. Several genes that may be implicated in the functional organization of primitive HPCs were overexpressed in the CD34+/CD38– fraction: insulin-like growth factor 2 (IGF2), MDR1, MN1, STMN2, ESAM 1, endomucin-2, and galectin-1. IGF2 is associated with proliferation and differentiation while maintaining a greater number of progenitor cells.38 MDR1 is a multiple drug efflux pump that is responsible for elimination of Rh-123 and has been reported to be characteristic for HSCs.39 MN1 is a tumor suppressor gene involved in an acute form of myeloid leukemia through translocation.40 The silencer element STMN2 is believed to play a role in neuronal differentiation. The ESAM1, endomucin 2, and galectin-1 are adhesion proteins that might have an impact on the interaction of CD34+/CD38– cells with the microenvironment.
In contrast, the CD34+/CD38+ population displayed higher expression of several genes that are associated with lineage commitment for mature blood cells, as myeoloperoxidase, T-cell receptor, mast cell carboxypeptidase a, and the erythroid transcription factors EKLF and GATA1. LEF1 is a nuclear protein expressed in pre-B and T cells that can form complexes with β catenin and is part of the WNT pathway.41 Other genes, such as cyclin B2, cyclin PCNA, and ki-67, might influence cell cycle kinetics in the CD34+/CD38+ population.42 Higher expression of ki-67 in the CD34+/CD38+ fraction and a correlation between CD38 expression and cell cycle status have been reported by other authors.43,44
Subsequently the gene expression profile of SDF versus FDF was analyzed. The SDF is highly enriched in functionally primitive and asymmetrically dividing cells, whereas cells from the FDF give rise to more committed progenitors. Indeed, we found several markers that have been associated with HSCs to be highly expressed in the SDF. Prominin (CD133), a marker associated with mobility and primitive function, was among the highest differentially expressed genes (13-fold).45,46 The multiple drug resistance gene 1 (MDR1) and the complement component 1 receptor 1 (clqr1), reported to be characteristic for stem cells, were both increased 5-fold.47 Several transcription factors that might have an impact on the hematopoietic differentiation were also higher expressed in the SDF, for example, the homeodomain proteins HOXA9 (3.9-fold), cdx1, and hesx1. The Kruppel-like factor 12 (klf12) has been reported to be highly expressed in the hematopoietic system of zebrafish.48 ERG resembles a transcription factor that is involved in a form of acute myeloic leukemia by chromosomal translocation49 ; IFI16 may function as a transcriptional repressor that is present in myeloid precursors (CD34+) and throughout monocyte development, but its expression is down-regulated in erythroid and polymorphonuclear precursor cells.50,51 Several adhesion proteins, including platelet endothelial cell adhesion molecule 1 (PECAM-1), protocadherin β4, intercellular adhesion molecule 3 (ICAM-3), leukocyte factor antigen 1 (LFA-1), and integrin β2, were also more highly expressed in the SDF and might be involved in the homing of stem cells or their interaction with the microenvironment. Selectin L (SELL) is a cell surface component that functions in leukocyte-endothelial cell interactions and was reported to be increasingly expressed on CD34+ CB cells during gestation.52 The cyclin G2 is a negative regulator of cell cycle progression as observed in murine B cells responding to growth inhibitory stimuli and may thus have an impact on the low proliferation of the SDF.53 HLA genes are organized in chromosome 6 under the additional transcriptional control of a locus control region (LCR).54 Thirteen independent HLA genes were highly up-regulated in the SDF. Although HLA-DR is usually considered to be expressed on more mature cells, it has been reported that CD34+/CD38–/HLA-DR+ cells have the potential to give rise to all hematopoietic lineages.2,4 We have shown that the CD34+/CD38–/HLA-DR+ subset from fetal tissues contained a higher concentration of candidate stem cells.4
In the FDF genes of the β-globin locus showed a much higher expression. The erythroid transcription factors gata1 and EKLF are well known regulators of the corresponding LCR and were more highly expressed in this population. Furthermore, other genes of the erythroid lineage are more highly expressed in the FDF: ALAS2, involved in heme biosynthesis; glycophorin b, a major sialoglycoprotein of the human erythrocyte membrane; and e-cadherin, a calcium-dependent adhesion protein interacting preferentially in a homophilic manner that is restricted to the erythroid lineage in human bone marrow.55,56
Thus the observed differential gene expression in the SDF and FDF is compatible with the observation that slow and asymmetrically dividing cells indeed represent a functionally more primitive population. On the other hand, differential gene expression in the FDF might imply that this fraction differentiated into several hematopoietic lineages during the 7 days of cultivation. A shorter incubation time might help to further elucidate the molecular and genetic differences between cells that self-renew versus cells that are destined to differentiate. Analysis of cell populations that differ by only one or 2 divisions might help to identify the most salient molecular differences and are underway.
Several studies on the gene expression of murine and human HSC fractions have been published recently.9-15 A combination of different data sets and the determination of the overlap in differential gene expression may shed light on gene products that are important for stem cell function.57-59 In comparison with 3 different microarray approaches9,10,15 we estimated the overlap of genes in different fractions of murine and human HSCs. Among the genes that were up-regulated in several fractions were frizzled 6 (FZD6) that might function as a receptor for the Wnt-pathway,60 RNA-binding protein with multiple splicing (RBPMS), MDR1, JAK3, and the homeodomain protein HOXA9. HOXA9 knockout mice showed defects in hematopoiesis, whereas HOXA9 overexpression increased transplantable lymphoid-myeloid long-term repopulating cells.61,62 A recent cDNA microarray analysis identified several target genes of HOXA9 that may mediate the biologic effects of this protein.63 Jak3, a nonreceptor tyrosine kinase, might be a regulator for differentiation because defects in Jak3 led to severe combined immunodeficiency.64,65 Although the different microarray studies compared used different starting material and methods this comparative analysis has revealed several candidate genes that were predominantly expressed in primitive subsets of HSCs.
It has been demonstrated before that primary human CD34+ cells from fetal liver, umbilical CB, and adult bone marrow and peripheral blood could form various types of pseudopodia morphologies.66,67 Lamellipodia-type processes are associated with migration.67 An unexpected observation in this study is that the majority of cells in the SDF demonstrated an elongated cell shape in comparison to the round cell shape in the FDF. Flow cytometric analysis has confirmed the significantly higher expression of CD133. CD133 has previously been described to be expressed on plasma membrane protrusions.68,69 Observation using immunefluorescence microscopy and time-lapse camera system confirmed that cells from the SDF possessed lamellipodia with strong expression of CD133.
Evidence indicates that the Rh-123low progenitor cell population is enriched in cells that are able to reconstitute hematopoiesis permanently.70 We have demonstrated that the SDF is highly enriched in Rh-123low cells as compared to the FDF. The MDR1 efflux pump has been reported to be responsible for eliminating Rh-123 and is thus associated with rhodamine low phenotype and with long-term repopulating activity.71 This is also in line with our observation that the MDR1 gene is about 5-fold higher expressed in the SDF.
In summary, we have used the novel Human Transcriptome Microarray tool to determine the gene expression profile of the SDF of CD34+/CD38– population. The molecular characteristics provided further evidence that this cell fraction is associated with primitive function and asymmetric division. The data obtained in this study will serve as a basis for future analyses, in particular of genes with yet unknown function that might play a significant role in asymmetric division and self-renewal.
Prepublished online as Blood First Edition Paper, April 13, 2004; DOI 10.1182/blood-2003-10-3423.
Supported by Deutsche Forschungsgemeinschaft (DFG) HO 914/2-1, HO 914/3-1, Bundesministerium für Bildung und Forschung (BMBF) 01GN0107, and Siebeneicher Stiftung, Germany.
An Inside Blood analysis of this article appears in the front of this issue.
The publication costs of this article were defrayed in part by page charge payment. Therefore, and solely to indicate this fact, this article is hereby marked “advertisement” in accordance with 18 U.S.C. section 1734.
We thank Bernhard Korn and the Resource Center and Primary Database (RZPD) for the supply of the IMAGE clones and their sequence verification as described in the publication on the production of the Human Transcriptome Microarray, Eike Buss for the assistance with the rhodamine-efflux assay, Heidi Rossmann for the assistance with the LightCycler RT-PCR, and Michael Punzel for valuable advice to these studies.

