Abstract
To evaluate the role of T-cell selection in the thymus and/or periphery in T-cell immune reconstitution after allogeneic bone marrow transplantation (allo-BMT), we have analyzed the overall and antigen-specific T-cell repertoires in pediatric allo-BMT recipients treated for leukemia. We observed a lack of overall T-cell receptor (TCR) diversity in the repopulating T cells at 3 months after allo-BMT, as was deduced from complementarity determining region 3 (CDR3) size distribution patterns displaying reduced complexity. This was noted particularly in recipients of a T-cell–depleted (TCD) graft and, to a lesser extent, also in recipients of unmanipulated grafts. At 1 year after allo-BMT, normalization was observed of TCR CDR3 size complexity in almost all recipients. Analysis of the antigen-specific T-cell repertoire at 1 year after BMT showed that the T cells responding to tetanus toxoid (TT) differed in TCR gene segment usage and in amino acid composition of the CDR3 region when comparing the recipient with the donor. Moreover, the TT-specific TCR repertoire was found to be stable within a given allo-BMT recipient, because TT-specific T cells with completely identical TCRs were found at 3 consecutive years after transplantation. These observations suggest an important role for T-cell selection processes in the complete restoration of the T-cell immune repertoire in children after allo-BMT.
ALLOGENEIC BONE MARROW transplantation (allo-BMT) is a possibly curative treatment of otherwise incurable malignant hematologic disorders and severe immunodeficiency diseases. After allo-BMT, the recipients demonstrate a varying period of immunoincompetence that can last for up to several years after transplantation and may cause significant morbidity and mortality.1-4 Moreover, immune reconstitution can be hampered by the occurrence of acute and chronic graft-versus-host-disease (GVHD).1,5 Immune reconstitution after allo-BMT has been studied extensively in adults.1,3,6,7 The innate immune system, ie, the function of phagocytes, fully recovers in the first weeks to months after BMT, whereas complete reconstitution of the adaptive immune system, ie, B and T lymphocytes, takes much longer. As a result, infectious complications exist for a prolonged time after allo-BMT.8
During normal T-cell development, bone marrow (BM)-derived T-cell precursors home to the thymus, where they are subjected to positive and negative selection processes upon interactions with major histocompatibility complex (MHC) class I and II molecules expressed on thymic epithelial and dendritic cells.9-11 These selection processes will ensure a nonautoreactive peripheral T-cell repertoire that is restricted to recognizing antigenic peptides in the context of self-MHC. Within the thymic micro-environment, MHC class II-mediated interactions result mostly in CD4+ T-cell development, whereas MHC class I-mediated interactions result in CD8+T-cell development. During T-cell selection in normal individuals, T-cell receptor (TCR)-B and TCR-A genes are sequentially and randomly rearranged from a pool of TCR gene segments, resulting in a diverse TCR repertoire.12-14 However, this repertoire is less diverse than theoretically possible due to nonrandom TCRV and TCRJ gene segment usage, nonrandom amino acid incorporation in the TCR complementarity determining region 3 (CDR3),15-17 and skewing of certain TCRBV and TCRAV gene segments towards CD4+ or CD8+ T-cell subsets.18 19
After the loss of mature T cells, such as occurs after chemotherapy or after myeloablative conditioning before allo-BMT, regeneration of the T-cell population can proceed via at least 2 pathways. First, transfer of graft-derived mature donor T cells to the periphery followed by antigen-driven expansion. This process, which represents a thymus-independent pathway of reconstitution, most likely provides the first wave of T cells after allo-BMT.20-22 These mature T cells with a limited TCR diversity23 can be maintained in the periphery for up to 10 to 20 years,24 provided that appropriate TCR-peptide/MHC interactions occur.25,26 The second mechanism involves selection of graft-derived precursor cells in the thymus27-29 and/or possibly at peripheral selection sites.30,31 The process of thymic T-cell selection probably accounts for the more durable reconstitution of the T-cell compartment and potentiates a more diverse TCR repertoire. Because thymic functions decrease with increasing age,4,22 this selection mechanism is thought to be the most effective in young allo-BMT recipients, as is reflected by the delayed recovery of especially CD4+ T cells in adult allo-BMT recipients.3,6 7
At present, it is not precisely known to what extent expansion of mature graft-derived T cells and thymic selection of precursor T cells contribute to T-cell immune reconstitution after allo-BMT in children. To address this question, we analyzed in the present study the overall and antigen-specific T-cell repertoires in well-defined groups of pediatric allo-BMT recipients, ie, grafted either with BM cells from an HLA-identical sibling donor or a matched unrelated donor (MUD) and within the latter group, with or without T-cell depletion (TCD) of the graft.
MATERIALS AND METHODS
Patients.
Between November 1994 and October 1996, 44 children with hematologic malignancies were treated with an HLA-identical allo-BMT at the Department of Pediatrics of the Leiden University Medical Center (Leiden, The Netherlands). Conditioning of the patients was performed according to protocols of the Dutch Childhood Leukemia Study Group (DCLSG). All children showed complete engraftment. Fifteen children died: 11 of relapse of the original disease and 4 of infection. For the purpose of our study, we selected 3 groups of patients: (I) myelodysplastic syndrome (MDS) patients treated with a TCD MUD BM graft; (II) (juvenile) chronic myeloid leukemia [(J)CML] patients treated with an unmanipulated MUD BM graft; and (III) acute leukemia patients treated with an unmanipulated HLA-identical sibling BM graft. The sibling donors were 6 to 25 years old (mean age, 13.1 years), whereas MUD donors in general were more than 30 years old. TCD (≥2 log) of the graft was achieved by albumin gradient centrifugation and subsequent E-rosette sedimentation.32 Twelve patients who are eligible for one of the transplantation groups and of which material of the donor was available were included in our study. These patients received between 0.75 × 10⁸ and 4.8 × 10⁸ nucleated BM cells (median, 2.4 × 10⁸) per kilogram of body weight (BW). All BMT recipients were included in a revaccination protocol with diphtheria toxoid (D)-tetanus toxoid (T)-inactivated polio virus type I, II, and III (IPV) on 10, 14, and 24 weeks after allo-BMT.33 For the purpose of this study, blood was drawn from the recipients at various time-points after allo-BMT and from their respective donors. The use of this human material has been approved by the Committee on Medical Ethics of the Leiden University Medical Center (Protocol P254/96).
Processing of peripheral blood mononuclear cells (PBMC), fluorescence-activated cell sorting (FACS) sorting, and immunophenotypical analysis.
PBMC were isolated from approximately 20 mL heparinized blood via Ficoll-Isopaque (LUMC Hospital Pharmacy, Leiden, The Netherlands) density centrifugation. PBMC (2 × 10⁶ to 3 × 10⁶) were used for FACS sorting to separate CD4+ and CD8+ T-cell subsets using fluorescein-conjugated anti-CD4 and R-phycoerythrin-conjugated anti-CD8 monoclonal antibodies (MoAbs; Dakopatts, Glostrup, Denmark) and a FACScan (Becton Dickinson, Mountain View, CA). FACS-sorted subsets (8 × 10³ to 3 × 10⁵ cells) were collected in fetal calf serum, washed twice in phosphate-buffered saline (PBS), and stored at −80°C until RNA extraction. Immunophenotypical analysis of PBMC was performed at regular intervals after allo-BMT by flow cytometric analysis using a FACStar flow cytometer and commercially available MoAbs in appropriate dilutions: the MoAbs used to discriminate the various lymphoid subsets were directed against CD3/CD4 or CD3/CD8 for T-cell subsets, CD3/CD16/CD56 for natural killer cells, and CD19 and/or CD20 for B cells. Normalization of the absolute number of cells in a given lymphocyte (sub)population in the peripheral blood of an allo-BMT recipient was defined as reaching the fifth percentile of age-matched reference values.34 36
Generation of antigen-specific T-cell lines/clones.
For the analysis of the antigen-specific TCR repertoire, tetanus toxoid (TT)-specific T-cell lines were generated as described previously.37 Briefly, 3 to 6 × 10⁶ PBMC were grown in culture medium in the presence of 1.9 limes flocculationis (lf)/mL TT (RIVM, Bilthoven, The Netherlands). After at least 2 rounds of TT-stimulation and subsequent TT-specificity testing in a 3H-thymidine incorporation assay, T-cell clones were generated from some of these lines by limiting dilution.38The T-cell lines and clones that, after repeated testing, had a stimulation index (SI) greater than 3, with more than 5 × 10³ counts per minute (cpm) in the case of T-cell lines or more than 1 × 10³ cpm in the case of T-cell clones, were considered to be TT-specific (SI= 3H incorporation of T+APC+TT/3H incorporation T+APC only). Epstein-Barr virus (EBV)-transformed B-cell lines of recipients and their respective donors (MUD/siblings) were used as antigen-presenting cells (APC) in these tests. Blocking of the proliferative response was analyzed as described previously37 using MoAbs directed against MHC class I (W6/32), MHC class II (PdV5.2), CD4 (RIV6), and HLA-DR (B8.11.2), which remained present during the entire assay.
RNA extraction, cDNA synthesis, and polymerase chain reaction (PCR) amplification.
Total RNA was extracted from FACS-sorted CD4+ and CD8+ T-cell subsets and from TT-specific T-cell clones (8 × 10³ to 1 × 10⁶ cells). The RNA was converted into cDNA using oligo-dT (Promega, Madison, WI). The cDNA was subjected to PCR amplification for the determination of TCR gene segment usage. PCR amplification and TCR-primers were as described previously.19 37
Spectratyping and method validation.
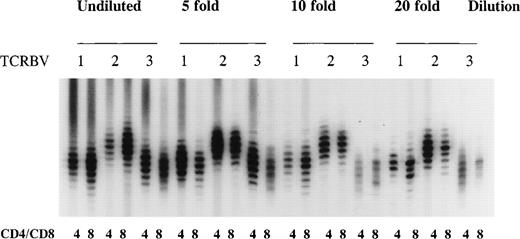
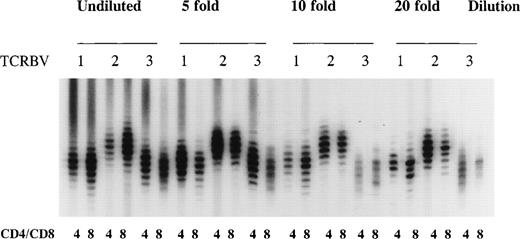
The distribution of TCR CDR3 sizes was analyzed by PCR.39PCR reactions were performed with 5′ TCRBV family specific primers (TCRBV1-23) and a 3′ generic TCRBC internal primer labeled with [γ-32P]ATP as described previously.37,39 To avoid a hampered size distribution due to very small numbers of T cells in the starting material, we used cDNA from at least 8 × 10³ sorted cells for each spectratype, because we and others40 41 have determined that approximately 2 × 10³ cells is the lowest number at which a near normal distribution of TCR CDR3 sizes with 8 to 10 distinct bands can be observed in the majority of the TCRBV families in CD4+ and CD8+ T-cell subsets (Fig 1). Furthermore, identical TCR CDR3 size distribution patterns were obtained after repeated spectratype PCR (results not shown).
Method validation of TCR CDR3 size distribution analysis. A cDNA sample of sorted CD4+ and CD8+ T cells from a healthy bone marrow donor was serially diluted to determine the number of cells at which a near normal distribution of TCR CDR3 sizes (8 to 10 bands) in the majority of the TCRBV families could be obtained after a TCRBV-specific spectratype PCR. Shown are the size distributions for undiluted cDNA and a 5-, 10-, and 20-fold dilution representing 30 × 103, 6.0 × 10³, 3.0 × 10³, and 1.5 × 10³ cells in each spectratype for TCRBV1, TCRBV2, and TCRBV3 in CD4+ and CD8+ T-cell subsets.
Method validation of TCR CDR3 size distribution analysis. A cDNA sample of sorted CD4+ and CD8+ T cells from a healthy bone marrow donor was serially diluted to determine the number of cells at which a near normal distribution of TCR CDR3 sizes (8 to 10 bands) in the majority of the TCRBV families could be obtained after a TCRBV-specific spectratype PCR. Shown are the size distributions for undiluted cDNA and a 5-, 10-, and 20-fold dilution representing 30 × 103, 6.0 × 10³, 3.0 × 10³, and 1.5 × 10³ cells in each spectratype for TCRBV1, TCRBV2, and TCRBV3 in CD4+ and CD8+ T-cell subsets.
PCR fragment purification and DNA sequencing.
The desired TCRBV PCR fragments were purified by electrophoresis in a 1% low melting point agarose gel and subsequent use of Wizard columns (Promega). The Wizard-purified fragment was used for direct sequencing42 using the T7 sequencing Kit (Pharmacia LKB, Uppsala, Sweden) with 5 to 10 pmol of TCRBC internal primer, approximately 0.25 pmol PCR fragment, and [α-33P]ATP (0.5 μCi; Dupont NEN, Boston, MA). DNA sequences were compared with TCR sequences contained in the GenBank using the PCGENE Computer Software Program (Release 6.85; Intelligenetics Inc, Palo Alto, CA).
Sequencing/spectratyping oligonucleotide primer.
The primer used for sequencing of the TCR of TT-specific T-cell clones and for the spectratype analysis was TCRBC internal (5′ TGT GGG AGA TCT CTG CTT CTG 3′).
TCR CDR3-specific oligonucleotide hybridization.
For the analysis of the persistence of TCR clonotypes, TCRBV9 PCR products were generated from TT-specific T-cell lines and clones,37 size-fractionated in a 1% agarose gel, and transferred to nylon membranes (HybondN+; Amersham, Little Chalfont, UK) in 20× SSPE for 17 hours. After blotting, filters were incubated in 0.4 N NaOH for 20 minutes and washed in 5× SSPE for 5 minutes at room temperature. Filters were prehybridized and hybridized at 60°C in 5× SSPE, 0.1% bovine serum albumin (BSA), 0.1% Ficoll, 0.1% polyvinylpyrolidone, and 0.5% sodium dodecyl sulfate (SDS). The oligonucleotide probe specific for the TCR CDR3 region of the UPN 285-derived sequence TCRBV9S1 PTGSG was composed of 5′ CAGTGCCGCTCCCTGTAGGGCTGC 3′ and was end-labeled with [γ-32P]ATP as described above. After the hybridization in a hybridization oven (Appligene Inc, Pleasanton, CA) for 17 hours at 60°C, the filters were washed once in 6× SSPE, 0.1% SDS, pH 7.5, for 15 minutes at 60°C and once in 6× SSPE, 0.1% SDS, pH 7.5, for 15 minutes at 78°C (Tm of the oligo). After washing, the filters were exposed to x-ray films at −80°C for 2 to 4 hours.
RESULTS
Transplant outcome.
Successful engraftment was observed in all analyzed children. In the total group of analyzed children (I-III), 9 of 12 survived (75%); in the group of allo-BMT recipients who received a TCD-BM graft (I), 2 of 3 children (67%) survived, and in the groups who received unmanipulated BM grafts (II+III), 7 of 9 children (78%) survived. Causes of death were relapse of the original disease in 2 children and EBV-induced B-cell lymphoproliferative disease (BLPD) in 1 child. Acute GVHD grade I was observed in 5 children and chronic GVHD developed in 4 children (3 limited and 1 extensive). Almost all survivors are alive with a follow-up of 3 to 4 years after allo-BMT and have a Karnofsky score of 100%, whereas UPN 298, who suffers from extensive chronic GVHD, including the liver, has a Karnofsky score of 80%. The transplant-related variables and the allo-BMT outcome of all analyzed patients are summarized in Table 1.
Immunological reconstitution: recovery of the main lymphocyte subsets.
Absolute lymphocyte counts below the fifth percentile (p5) of age-matched reference values34 35 were observed in 10 of 12 children at 3 months after allo-BMT, as shown in Table 2. The absolute numbers of CD3+ T cells at this time-point were below p5 values in 8 of 12 recipients. In 4 of 12 allo-BMT recipients, all from the unmanipulated graft groups, normal numbers of CD3+ T cells were detected. The absolute number of CD4+ T cells was low in almost all recipients at 3 months after allo-BMT (11 of 12 patients), irrespective of the nature of the graft (TCD or unmanipulated). In contrast, CD8+ T-cell numbers were either normal (6 of 12 patients), increased (2 of 12 patients), or decreased (4 of 12 patients) at this time-point. The absolute number of NK cells (CD3−CD16+56+) was normal at 3 months post-BMT in the majority of the recipients (11 of 12), whereas the absolute number of B cells (CD20+) was decreased in the majority of the analyzed recipients (8 of 12). Similar analyses at 1 year after allo-BMT showed normalization of lymphocyte numbers in the majority of the patients (Table 2). The absolute number of CD3+ cells increased in 7 of 9 patients when comparing the 2 time-points. However, CD3+ T-cell numbers remained below the p5 of reference values in 3 of 9 patients at 1 year after BMT. Similar observations were made for CD4+ T cells. CD8+ T cells either reached normal values (4 of 9 patients) or were slightly increased (4 of 9 patients) at 1 year after allo-BMT. The number of NK cells (CD3−CD16+CD56+) cells reached normal levels in the majority of the patients (7 of 9 patients), whereas B-cell numbers (CD20+) were either normal (5 of 9 patients) or slightly increased (4 of 9 patients) at this time-point.
CD45RA and CD45RO expression profiles on CD4+ and CD8+ T-cell subsets.
At approximately 3 months after allo-BMT, the absolute number of CD4+ T cells expressing CD45RA was low in all 11 children investigated (mean, 0.037 × 10³ cells/μL), whereas the absolute number of CD8+ T cells expressing this marker was much higher (mean, 0.29 × 10³ cells/μL; Table 3). The absolute number of CD4+ T cells expressing the memory marker CD45RO (mean, 0.21 × 10³ cells/μL) was significantly higher than the number of CD4+CD45RA+ T cells. Within the CD8+ T-cell subset, expression of CD45RA and CD45RO was variable: the absolute number of CD8+CD45RO+ T cells was higher than that of CD8+CD45RA+ T cells in 5 of 11 patients, lower in 3 of 11 patients, and in the same range in 3 of 11 children. Similar analyses at 12 months after allo-BMT showed an increase in the number of CD4+CD45RA+ T cells in 9 of 9 recipients, but the counts were still below the p5 of age-matched reference values in the majority of the patients. Moreover, an increase in the absolute number of CD8+CD45RA+ T cells was observed in 8 of 9 recipients. Absolute numbers of memory (CD45RO+) cells also increased in CD4+ as well as in CD8+T-cell subsets, in 7 of 9 and 4 of 9 recipients, respectively, showing expansion of memory-type T cells within the first year after transplantation.
TCR CDR3 size profile analysis.
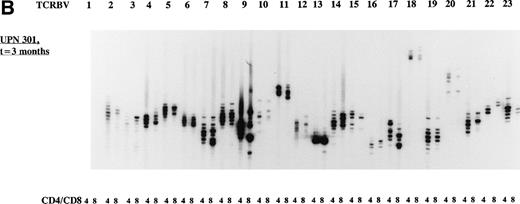
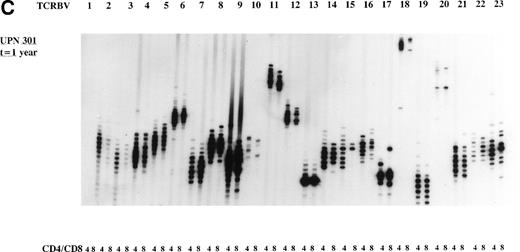
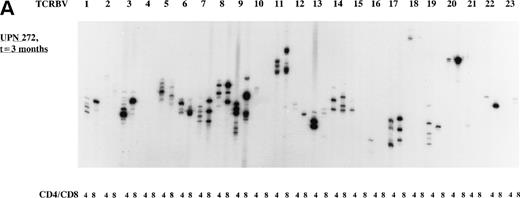
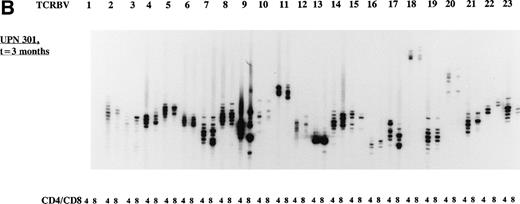
The overall TCR repertoire diversity was investigated by evaluation of the TCR CDR3 size distribution patterns. Spectratype analysis of TCD-graft recipients (group I) at 3 months after allo-BMT demonstrated TCR CDR3 size distribution patterns that were deviated from a Gaussian distribution in both T-cell subsets in the majority of the TCRBV families (Table 4) when compared with their donors or age-matched controls who displayed Gaussian distributed spectratypes (results not shown). It should be noted that the TCD-grafts contained approximately 0.69% (∼1.7 × 10⁶/kg BW of the recipient) mature T cells after the depletion procedure as estimated by FACS analysis (results not shown). At 1 year post-BMT, a more or less normal distribution of TCR CDR3 sizes was observed in the majority of the TCRBV families in these TCD graft recipients when a similar number of cells was used as for the early analysis. Analyses of TCR CDR3 size distribution patterns in unmanipulated-graft recipients (group II+III) showed less heterogenous patterns at 3 months after transplantation, whereas a Gaussian distribution of TCR CDR3 sizes could be observed at 1 year after allo-BMT. When comparing the spectratypes at 3 months after transplantation in the 3 transplantation groups, a more diverse TCR repertoire was observed in the unmanipulated graft groups (3 of 4 children), as summarized in Table 4, irrespective of the number of cells used for the analyses. For example, the deviated TCR CDR3 size distribution pattern of UPN 272 at 3 months after BMT, the less heterogenous size distribution (3 months post-BMT) of UPN 301, and the Gaussian size distribution (1 year post-BMT) of UPN 301 were all generated with 8 × 10³ cells. Representative examples of TCR CDR3 size distribution patterns are shown in Fig 2.
Representative examples of deviated and normal TCR CDR3 size distributions. (A) Analysis of CDR3 size distribution patterns in UPN 272 at 3 months after allo-BMT in CD4+ and CD8+ T-cell subsets as an example of a deviated/less heterogenous distribution of TCR CDR3 sizes. (B) Similar analysis in UPN 301 at 3 months after allo-BMT in CD4+ and CD8+ T-cell subsets as an example of a less heterogenous/Gaussian distribution of TCR CDR3 sizes. (C) UPN 301 at 1 year after allo-BMT in CD4+ and CD8+ T-cell subsets as an example of a Gaussian distribution of TCR CDR3 sizes. Lanes indicate from left to right TCRBV families (1 through 23).
Representative examples of deviated and normal TCR CDR3 size distributions. (A) Analysis of CDR3 size distribution patterns in UPN 272 at 3 months after allo-BMT in CD4+ and CD8+ T-cell subsets as an example of a deviated/less heterogenous distribution of TCR CDR3 sizes. (B) Similar analysis in UPN 301 at 3 months after allo-BMT in CD4+ and CD8+ T-cell subsets as an example of a less heterogenous/Gaussian distribution of TCR CDR3 sizes. (C) UPN 301 at 1 year after allo-BMT in CD4+ and CD8+ T-cell subsets as an example of a Gaussian distribution of TCR CDR3 sizes. Lanes indicate from left to right TCRBV families (1 through 23).
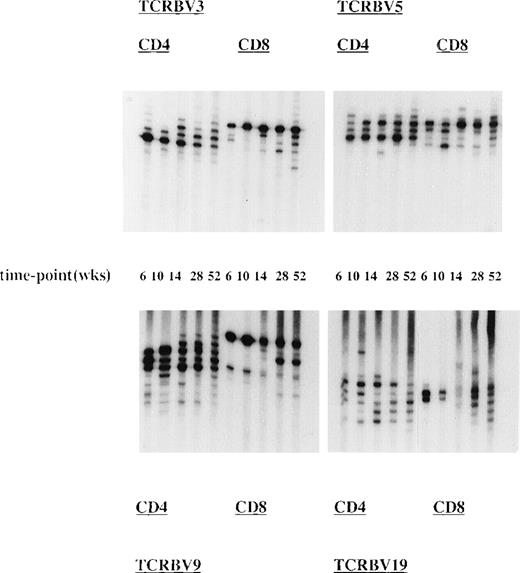
To study the kinetics of the TCR repertoire development more closely, we have analyzed TCR CDR3 size distribution patterns of UPN 272 (group I) at 5 time-points after allo-BMT in CD4+ and CD8+ T-cell subsets (Fig 3). This showed the presence of dominant T-cell clonotypes early after allo-BMT, ie, at 6 to 10 weeks in almost all analyzed TCRBV families in both T-cell subsets. These early T-cell clonotypes most probably represent donor memory T cells contained in the BM graft. At later time-points, the TCR diversity increased, but the dominant clonotypes remained present. However, the TCRBV9, TCRBV20, and TCRBV22 spectratypes remained less heterogenous in the CD8+ T-cell subset at later time-points (Fig 3).
Presence and persistence of dominant TCR clonotypes after allo-BMT. Longitudinal analysis of TCR CDR3 size distribution patterns in UPN 272 (transplantation group I) at 6, 10, 14, 28, and 52 weeks after the TCD allo-BMT. Shown are spectratypes of TCRBV3, TCRBV5, TCRBV9, and TCRBV19 in the CD4+ as well as in the CD8+ T-cell subsets
Presence and persistence of dominant TCR clonotypes after allo-BMT. Longitudinal analysis of TCR CDR3 size distribution patterns in UPN 272 (transplantation group I) at 6, 10, 14, 28, and 52 weeks after the TCD allo-BMT. Shown are spectratypes of TCRBV3, TCRBV5, TCRBV9, and TCRBV19 in the CD4+ as well as in the CD8+ T-cell subsets
TT-specific T-cell immune response after allo-BMT.
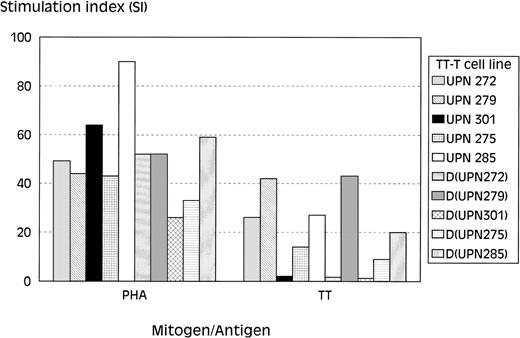
To follow the restoration of the proliferative response against the recall antigen TT in time, PBMC obtained at 6, 10, 14, 32, and 52 weeks after allo-BMT were stimulated with TT. The responding T cells were tested for their TT-specificity in 3H thymidine incorporation assays. These analyses showed the lack of a significant proliferative response to TT in T-cell lines of all 6 recipients generated at the early time points (4 to 14 weeks) after allo-BMT (Table 5), whereas the response of these T-cell lines to phytohemagglutinin (PHA) was in normal range (SI, 30 to 145) at these time-points (results not shown). The T-cell line of UPN 275 generated at 14 weeks after allo-BMT showed a very weak proliferative response to TT (SI, ∼5), albeit with counts less than 10 × 103 cpm. Furthermore, T-cell–dependent B-cell reponses to TT were also lacking at these time-points in all analyzed recipients, as shown by the level of TT-specific Igs that did not increase after repeated DTP-vaccination (results not shown). Of note was the observation that, after 3 DTP-vaccinations, the TT-specific B-cell responses were completely absent in 5 of 6 analyzed recipients, with the only exception being UPN 275, who showed a moderate increase in TT-specific Igs (both IgG1 and IgG3) after the third vaccination (results not shown). T-cell lines generated at 32 weeks after transplantation were found to be TT-specific in 4 of 5 analyzed recipients, as were T-cell lines generated at 52 weeks after allo-BMT (Table 5 and Fig 4). The lack of a proliferative response to TT in UPN 301 corresponded with standard PBMC culture assay results (results not shown). A similar analysis of T-cell lines of the respective BM donors (Fig 4) showed normal proliferative responses to PHA (SI, 26 to 59) in all 5 analyzed donors, whereas only 3 of 5 donors responded to TT (SI, 1.3 to 43), which is probably related to the TT-vaccination status of these donors.
Proliferative responses of T-cell lines at 1 year after allo-BMT. 3H-thymidine incorporation assays of TT-specific T-cell lines after stimulation with PHA, TT, or culture medium as negative control. Depicted on the y-axis is the SI: SI =3H thymidine incorporation of T-cell lines + APC+ TT/3H thymidine incorporation of T-cell lines + APC only. Shown are the results of 2 recipients of transplantation groups I (UPN 272 and 279) and III (UPN 275 and 285) and of 1 recipient of group II (UPN 301) and of their corresponding BM donors.
Proliferative responses of T-cell lines at 1 year after allo-BMT. 3H-thymidine incorporation assays of TT-specific T-cell lines after stimulation with PHA, TT, or culture medium as negative control. Depicted on the y-axis is the SI: SI =3H thymidine incorporation of T-cell lines + APC+ TT/3H thymidine incorporation of T-cell lines + APC only. Shown are the results of 2 recipients of transplantation groups I (UPN 272 and 279) and III (UPN 275 and 285) and of 1 recipient of group II (UPN 301) and of their corresponding BM donors.
Because almost all allo-BMT recipients have received cyclosporin A (CsA) as GVHD prophylaxis until 40 weeks after transplantation (Table 1), we used the T-cell lines generated at 52 weeks after allo-BMT for the analysis of T cells at the clonal level. T-cell clones were generated from TT-specific T-cell lines derived from UPN 275 and UPN 285 of the unmanipulated graft group (group III) and from their BM donors by limiting dilution. Because both UPN 275 and UPN 285 were transplanted with a sex-mismatched graft, chimerism patterns could be determined via X-Y fluorescence in situ hybridization (FISH),43 which showed that the T cells in both recipients were completely of donor origin (results not shown). The TT-specific proliferation of these donor-type T cells was found to be CD4-mediated and HLA-DR–restricted, because the addition of anti-CD4 MoAb, anti-MHC class II MoAb, or anti-HLA DR MoAb inhibited this proliferative response with 77% to 91%, whereas after the addition of anti-MHC class I MoAbs, only a nonspecific inhibition of 29% to 40% could be observed (Fig 5).
Determination of the restriction element of T-cell clones upon inhibition of TT-specific proliferation with specific MoAbs. Percentage blocking of TT-specific proliferation was determined using anti-CD4 (RIV6), anti-MHC class I (W6/32), anti-MHC class II (PdV5.2), and anti-HLA DR (B8.11.2) MoAbs. In each experiment, autologous B-cell lines were used as APC. Percentage inhibition was calculated as follows:100 − (SI TT+MoAb/SI TT alone × 100%). Shown are the results of 2 representative T-cell clones ([▪] UPN275 cl 40 and [▩] UPN 285 cl 2).
Determination of the restriction element of T-cell clones upon inhibition of TT-specific proliferation with specific MoAbs. Percentage blocking of TT-specific proliferation was determined using anti-CD4 (RIV6), anti-MHC class I (W6/32), anti-MHC class II (PdV5.2), and anti-HLA DR (B8.11.2) MoAbs. In each experiment, autologous B-cell lines were used as APC. Percentage inhibition was calculated as follows:100 − (SI TT+MoAb/SI TT alone × 100%). Shown are the results of 2 representative T-cell clones ([▪] UPN275 cl 40 and [▩] UPN 285 cl 2).
DNA-sequence analysis of TT-specific T-cell clones after allo-BMT and detection of stable TCR CDR3 clonotypes in T-cell lines.
When comparing TCR sequences of TT-specific T-cell clones from allo-BMT recipients (group III) with those from their donors, a striking dissimilarity was found in the usage of TCRBV and TCRBJ gene segments and in the amino acid composition of the CDR3 region (Table 6). This suggests that the T cells responding to TT in the recipients at 52 weeks after allo-BMT are composed of newly selected precursor T cells that are educated in the recipient. The number of different TCR sequences was low in the donors (3 to 5) and high in the recipients (11 to 13), which may reflect a relative naive anti-TT immune response in the patient and a memory-type immune response in the donor. In all analyzed individuals, one particular TCR sequence was found multiple times, showing the dominant character of these clones in the TT-specific T-cell lines (Table 6, in italics).
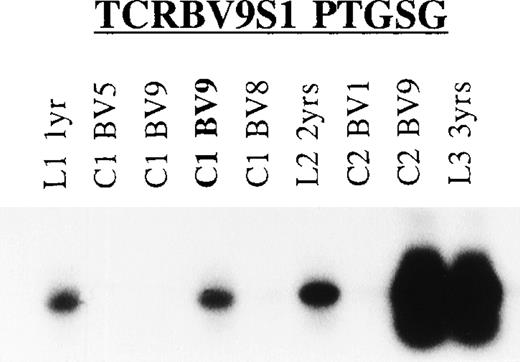
Longitudinal analysis of the T cells responding to TT showed stability of the TCR repertoire within 1 allo-BMT recipient (UPN 285; Fig 6). The presence of T cells expressing the TCRBV9S1 (PTGSG) TCR (Table 5) could be demonstrated in TT-specific T-cell lines and/or clones of UPN 285 generated at 3 consecutive years after allo-BMT (Fig 6); similar results were obtained with the TCRBV1S1 (GLG) and TCRBV5S1 (YRGLAQG) TCRs (results not shown). Moreover, the presence of T cells with the donor-type TCRBV5S6 TCR (GGLAG I) could not be demonstrated in the UPN 285-derived T-cell lines and clones at the 3 analyzed time-points (results not shown), arguing against a major role for peripheral expansion of graft-derived memory T cells in this patient.
Longitudinal TCR analysis of T cells responding to TT. Shown is the Southern blot of the TCRBV9 PCR products of TT-specific T-cell lines and clones obtained from UPN 285 at 3 consecutive years after allo-BMT using the TCR CDR3-specific TCRBV9S1 (PTGSG) oligonucleotide (Table 6) as hybridization probe. L1, TT-T cell line generated at 1 year after allo-BMT; C1, T-cell clone at 1 year post-BMT; L2/C2, line/clone 2 years post-BMT; L3, line 3 years post-BMT with TCRBV family (TCRBV1, TCRBV5, TCRBV8, and TCRBV9). In bold is the TCR CDR3 sequence for which the oligonucleotide probe was designed.
Longitudinal TCR analysis of T cells responding to TT. Shown is the Southern blot of the TCRBV9 PCR products of TT-specific T-cell lines and clones obtained from UPN 285 at 3 consecutive years after allo-BMT using the TCR CDR3-specific TCRBV9S1 (PTGSG) oligonucleotide (Table 6) as hybridization probe. L1, TT-T cell line generated at 1 year after allo-BMT; C1, T-cell clone at 1 year post-BMT; L2/C2, line/clone 2 years post-BMT; L3, line 3 years post-BMT with TCRBV family (TCRBV1, TCRBV5, TCRBV8, and TCRBV9). In bold is the TCR CDR3 sequence for which the oligonucleotide probe was designed.
DISCUSSION
In the present study, we analyzed the T-cell immune recovery in well-defined groups of pediatric allo-BMT recipients to investigate the relative contribution of expansion of transferred mature donor T cells and of thymic selection of donor precursor T cells in this process. Immunophenotypic analysis showed that the pediatric recipients analyzed in this study have extremely low numbers of CD4+ and low to normal numbers of CD8+ T cells (Table 2) at 3 months post-BMT, which is in line with previously published data from TCD BMT46-48 as well as from full graft BMT in children.48-51 At this time-point, the absolute number of CD4+ T cells expressing the CD45RA+ naive marker was low, whereas the number of CD8+ T cells expressing this marker was much higher (Table 3).41,49-51This relatively quick recovery of CD8+ T cells expressing CD45RA may be due to selection via an alternative regeneration pathway as proposed for regeneration in a thymectomized pediatric allo-BMT recipient50 or, less likely, due to conversion of CD45RO+ cells to CD45RA+ end-stage effector T cells. These CD8+CD45RA+ end-stage effector cells with a LFA1high and/or CD29high phenotype have been found in adults and also in children, albeit to a much lesser extent.52,53 At 1 year after allo-BMT, naive CD4+CD45RA+ T-cell numbers increased but remained below age-matched reference values in the majority of the analyzed recipients (Table 3). This finding is in contrast with the quick recovery of naive CD4+ T cells that was observed in children after convential chemotherapy.54 It can be argued that the preparative regimen including total body irradiation (TBI), which was administered to our patients before allo-BMT and the CsA, which was administered as GVHD prophylaxis,55 56 may have damaged the thymus more severely and, therefore, may have delayed the recovery of naive CD4+T cells. Of note was the observation that the memory-type (CD45RO+) T cells increased as well, in particular in the CD4+ T-cell subset (Table 3), suggesting that naive cells may have become memory cells after proper activation or that mature graft-derived memory cells may have expanded in these allo-BMT recipients.
Analysis of the TCR diversity at 3 months post-BMT showed that pediatric recipients of TCD grafts and, to a lesser extent, those receiving unmanipulated grafts display deviated TCR CDR3 size distribution patterns in the majority of TCRBV families (Table 4 and Fig 2). The skewed size profiles were not due to small numbers of cells in the spectratype analyses, because sufficient T cells were used to ensure a normal distribution (Fig 1). These observations are in concordance with data from adult BMT57 but are in contrast with other studies only showing limited TCR diversity in recipients of a TCD graft but not in recipients of unmanipulated grafts.23,39,58,59 Differences in cell populations used, ie, PBMC versus sorted CD4+ and CD8+ T-cell subsets, for the size distribution analysis and the time of analysis after allo-BMT may account for these differences. The TCR CDR3 size complexity increased to normal levels in the majority of the recipients within the first year after allo-BMT, irrespective of the nature of the graft and irrespective of the CD4/CD8 ratio (Table 4). Furthermore, we were able to show that the few dominant TCR clonotypes that were present early after transplantation persisted at later time-points (Fig3). These dominant TCR clonotypes most likely represent mature graft-derived T cells, because all grafts, even the TCD ones, contained substantial numbers of T cells. Whether these clones persist and/or expand after allo-BMT due to acute GVHD,57,60infections,61,62 or other antigenic exposure is a matter of debate. However, there is no correlation with acute GVHD in our study, because only mild GVHD (grade I) was observed. Only UPN 298, who suffered from acute GVHD grade I and extensive chronic GVHD, displayed a skewed TCR CDR3 size distribution pattern even at 1 year after allo-BMT (Table 4). Although TCR repertoire diversity increased in the majority of the young allo-BMT recipients within the first year after allo-BMT, which is suggestive for a role of precursor T-cell selection most probably in the thymus, some TCRBV families remained less heterogenous in the CD8+ T-cell subset (Fig 3), which could be related to the age of the matched unrelated donor.63 64
TT-specific T-cell proliferative responses were found to be absent at the early time points after allo-BMT in all analyzed recipients (Table5), which may correlate with the low number of CD4+ T cells (Table 2), most probably resulting in a low number of T-cell precursors directed against TT. Alternatively, the GVHD prophylaxis with CsA that was administered until 40 weeks after transplantation may underlie this lack of antigen-specific proliferative T-cell responses. Besides a direct effect on the thymic microenvironment influencing T-cell selection, CsA blocks the transcription of the IL-2 gene via interference with promoter occupancy in naive as well as in activated T cells and may therefore inhibit the activation of newly selected precursor cells with TT as well as the reactivation of graft-derived TT-specific memory T cells.65 66
All further molecular analyses were therefore performed with the T-cell lines generated at 52 weeks after allo-BMT, ie, after discontinuation of the CsA treatment. These TT-specific T-cell clones were all CD4+ and recognized TT with HLA-DR as restriction element (Fig 5). Longitudinal analysis of the T cells responding to TT showed that at least part of the TCR repertoire is stable within a given allo-BMT recipient (Fig 6), as was reported before for responses against HIV 1 glycoprotein 41,67 the EBV-encoded EBNA 3,68 and the influenza A matrix peptide M1.69,70 However, when the TCR-sequences of TT-specific T-cell clones of recipients (group III) were compared with those of their donors, striking differences were observed in the TCR gene segment usage and in the amino acid composition of the TCR CDR3-region (Table 5). Although we cannot exclude that these antigen-reactive T cells recognize different TT-epitopes, these observations suggest that the TT-reactive T cells present in the recipient at 52 weeks after allo-BMT originate from donor-derived precursor cells that have been selected in the recipient either in the thymus27-29 or extrathymically.30,31 This is supported by the observation that all T cells in UPN 275 and UPN 285 were of donor origin at 52 weeks post-BMT. Furthermore, in both children, the absolute number of naive CD4+CD45RA+ T cells, which are most probably recent thymic emigrants, increased in time (Table 3). Previous studies in SCID patients have shown differential MHC restriction patterns after HLA haploidentical BMT, which also points to a thymic-dependent pathway for the regeneration of CD4+ T cells after transplantation.37 71
The mechanisms involved in the complete restoration of the T-cell immune repertoire after allo-BMT in humans are poorly understood. Peripheral expansion of mature graft-derived T cells4,22 as well as selection of precursor T cells22,29 in the thymus or extrathymically are thought to play an important role in this process. The T-cell selection pathway, which may be affected by aging,72 is probably more important for the complete recovery of CD4+ than for CD8+ T cells, because the latter population recovers earlier after BMT (Table 3) and even in thymectomized pediatric recipients50 and in adults.7 41 The recovery of CD4+ and CD8+ T-cell numbers, the increase of overall TCR-diversity, the restoration of an antigen-specific proliferative response, and the differences in TCR gene segment usage of TT-specific T cells that were observed in our pediatric recipients within the first year after allo-BMT most likely point to complete T-cell immune reconstitution via selection of precursor T cells in the thymus and possibly also at extrathymic sites.
ACKNOWLEDGMENT
The authors thank Drs Sam Gobin, Tuna Mutis, and Frans Claas for critically reading the manuscript; Maarten van der Keur and Arie van de Marel for FACS sorting and analysis; Renée Langlois van den Bergh, Jaqueline Waaijer, and Monique ten Dam for immunophenotyping of blood samples; and Els Jol-van der Zijde for analysis of the antibody responses to TT.
Supported in part by the J.A Cohen Institute for Radiopathology and Radiation Protection (IRS).
The publication costs of this article were defrayed in part by page charge payment. This article must therefore be hereby marked “advertisement” in accordance with 18 U.S.C. section 1734 solely to indicate this fact.
REFERENCES
Author notes
Address reprint requests to Peter J. van den Elsen, PhD, Department of Immunohematology and Blood Transfusion, Leiden University Medical Center, Bldg 1, E3-Q, PO Box 9600, 2300 RC Leiden, The Netherlands; e-mail: pvdelsen@euronet.nl.



![Fig. 5. Determination of the restriction element of T-cell clones upon inhibition of TT-specific proliferation with specific MoAbs. Percentage blocking of TT-specific proliferation was determined using anti-CD4 (RIV6), anti-MHC class I (W6/32), anti-MHC class II (PdV5.2), and anti-HLA DR (B8.11.2) MoAbs. In each experiment, autologous B-cell lines were used as APC. Percentage inhibition was calculated as follows:100 − (SI TT+MoAb/SI TT alone × 100%). Shown are the results of 2 representative T-cell clones ([▪] UPN275 cl 40 and [▩] UPN 285 cl 2).](https://ash.silverchair-cdn.com/ash/content_public/journal/blood/94/12/10.1182_blood.v94.12.4358/5/m_blod42402005x.jpeg?Expires=1767704996&Signature=sFKWxg0rAn5u~LIhsn8WT0D6NsgVg1H828pdVgowLjchkwVX7qYs0376ixQmETpstkGg3FiQc~C~YMo8UvZ7RA77ThIhENPJ2HkAVF3TYvD9mbI6vw9yQEXXxRP0KK78YaRBICNbeqaiDKiQRK34sw-abd~rnuXYWc-LMUo-XglZ9OmK0GSOo68JHLGu7sh7Pul6fyb0ZmQNQb3eH-3Qj9SqiGkqmkgCYEv-geIdc~UW74dKYkQ4Wn2LbSmn2OM8SoWC1eROHw-qcPwcIaii9bBkbFj-40QUJpeO6AC2tVqu7tueOJGFrBRKulQ41~9A9gKpMx0md8P3Zeh9L4RbjQ__&Key-Pair-Id=APKAIE5G5CRDK6RD3PGA)



![Fig. 5. Determination of the restriction element of T-cell clones upon inhibition of TT-specific proliferation with specific MoAbs. Percentage blocking of TT-specific proliferation was determined using anti-CD4 (RIV6), anti-MHC class I (W6/32), anti-MHC class II (PdV5.2), and anti-HLA DR (B8.11.2) MoAbs. In each experiment, autologous B-cell lines were used as APC. Percentage inhibition was calculated as follows:100 − (SI TT+MoAb/SI TT alone × 100%). Shown are the results of 2 representative T-cell clones ([▪] UPN275 cl 40 and [▩] UPN 285 cl 2).](https://ash.silverchair-cdn.com/ash/content_public/journal/blood/94/12/10.1182_blood.v94.12.4358/5/m_blod42402005x.jpeg?Expires=1767704997&Signature=GvToFyexRJXD-31S6Pu6JieJquMUrgbvtIzj3jZbUGYeQHbB9-UsDbddTkofMHnmJFA9tHNChx3tEd3riQLvSDvOaD-GvYV1XkKM4bUY35IGfAS~Oe3naBovrz5AgrkRa20mlT5GwuBnCiYLWun7CO965plxnTXoMSTRG9mGIy6jIqG2KDLEpug1sGdPV2YYFL6dGYx9~2qKy97wG4H6jRZkMZFvz9MYnJsuMjkiJ3r74Gi1sqtofiNeEPlF-mxkCi9IvxlZR0jyQNYd~lzMIhExOTczDIR0yg8jgl0yLnaL77NWfvI-yEBcTobqrlToupXZFX6bdVY4JFqTjyHZVw__&Key-Pair-Id=APKAIE5G5CRDK6RD3PGA)
